Reading Traces

Capturing information is useless unless you know how to use it. Here’s what I use to get the most out of my basic trace of anything taking over so many seconds. This is also my template for more invasive traces, and it gets tweaked on a case-by-case basis.

It’s my typical style with half of it commented out where less run portions can be highlighted and run and portions of my WHERE clause don’t have to be rewritten to be added in. The first line gets highlighted as soon as I open this script every time so I can run it, copy the path of the trace I’m looking for, and paste it into my main script. As for the WHERE clause, call me lazy or whatever it is you call people who can’t remember the right word, but I don’t always remember the exact wording of each column name that I want to filter by. I simply uncomment them as I need them.

The only thing I can say is really impressive here is finding the job names, which is a piece of this script I will never forget figuring out. Other than that, just little things to help readability when both running this script and when playing with the WHERE clause. I can’t tell you why duration is microseconds and CPU is milliseconds, but I can say the SELECT and WHERE clauses are set up to use the same units I would use when I talk to someone.

--SELECT * FROM sys.traces

/*
--sp_trace_setstatus id, status
exec sp_trace_setstatus 3,0 --stop
exec sp_trace_setstatus 3,2 --close
--0 stop
--1 start
--2 close
*/

--query running trace
SELECT TOP 10000 Database_Name = DB_Name(DatabaseID)
    , DatabaseName
    , starttime
    , endtime
    , textdata = cast(textdata as varchar(4000)) 
    , Duration_Sec = cast(duration/1000/1000.0 as Dec(10,1)) 
    , CPU_Sec = cast(cpu/1000.0 as Dec(10,1)) 
    , Reads_K = cast(reads/1000.0 as Dec(10,0)) 
    , Writes_K = Cast(writes/1000.0 as Dec(10,1)) 
    , hostname  
    , LoginName 
    , NTUserName 
    , ApplicationName = CASE LEFT(ApplicationName, 29)
                    WHEN 'SQLAgent - TSQL JobStep (Job '
                        THEN 'SQLAgent Job: ' + (SELECT name FROM msdb..sysjobs sj WHERE substring(ApplicationName,32,32)=(substring(sys.fn_varbintohexstr(sj.job_id),3,100))) + ' - ' + SUBSTRING(ApplicationName, 67, len(ApplicationName)-67)
                    ELSE ApplicationName
                    END 
    , SPID
    , TE.*
FROM fn_trace_gettable('D:\Traces\DurationOver10sec_110.trc',default) T
    LEFT JOIN sys.trace_events TE ON  T.EventClass = TE.trace_event_id
WHERE endtime > DATEADD(Hour, -3, GetDate()) 
    --AND Duration > 1000000 * 15 --in seconds
    --AND CPU > 1000 * 10 --in seconds
    --AND Writes > 10000
    --AND Reads > 1000000
    --AND te.category_id = 2 --Auto Grow/Shrink found in default trace
    --AND t.databaseid = DB_ID('master')
    --AND t.DatabaseName = 'tempdb'
    --AND t.LoginName <> 'shood'
    --AND t.textdata like '%%'
ORDER BY endTime DESC, starttime DESC

So, for those of you not too familiar with tracing, what does all of this mean and what am I looking for? It depends on what’s wrong. The day after an app’s upgrade I’m looking for procs that snuck through testing and are killing the server. When a user complains about performance you might see a new proc showing up because it’s getting a bad execution plan. If tempdb or the logs fill up I can tell you what had 100,000 writes and just happened to end at that exact moment. Sometimes I’ll glance to see if anything is hitting or approaching the app’s 30 second timeout.

A general trace such as the RPC:Completed and SQL:BatchCompleted that take over X seconds won’t answer all of your questions, but it will be a good start. The most important things are to always have something running (could be extended events instead of a trace) to tell you the big things that are running and to have your monitoring limited enough where you aren’t the one slowing down the server. Make sure it’s customized to each server since a 1 second duration in a web app is a big deal, but other servers you would get flooded with results unless you bump it up to 10 seconds. You can run more invasive traces when you need them.

There are two hits against extended events where I’m even using traces for this. First, I still have too many SQL 2005 servers around and like to do things as consistent as reasonably possible across all servers to make it simple. Second, I’m still not too happy about extended events skipping SQL:BatchCompleted in SQL 2008 as that misses out on finding large loops of small statements. Extended events are much more efficient, can do a lot that traces can’t do, but aren’t a 100% replacement for traces.

Comment on my posts, let me know what you think. Every post I have at Simple SQL Server is written to myself 5 years ago, and is exactly what I wish I had back then in my own mind. The key words being “in my own mind”, and I’d like to hear what’s on your mind. Be it constructive criticism on this post or a completely separate SQL Server subject you wish you knew more about either now or 5 years ago that you’d like to see thrown up for everyone to use, I’ll never know until you tell me.

Tracing Introduction

SQL Server tracing is essential for troubleshooting performance issues, yet it can put loads on your server that would cause noticeable slowness, capture so much information that it fills the drive, and I’ve even seen it cause a cluster failover more than once.  With a tool this powerful you just need to know how to use it before you use it.  It’s almost like the idea where companies want their entry-level people to have a year of experience.

There is one trace I’d like to see on every server, preferably as a startup proc or a job that starts automatically when SQL Agent starts.  It doesn’t matter how you do it, if you want me to be happy you’ll tell me this was running for at least 24 hours before you had a performance incident.  All I’m looking for is RPC:Completed and SQL:BatchCompleted with a reasonable filter of duration over 10 seconds.

If you’ve never used Profiler before, here’s a quick overview to make the server-side trace I’m using.  Leave the first screen at the defaults, with the possible exception of changing the template to blank.  Select RPC:Completed and SQL:BatchCompleted and set the Duration filter to greater than or equal to 10,000 ms which you can get to using the “Column Filters…” button.  You can collect all columns if you want to, it won’t hurt with these events although there are some columns that won’t help.

Create trace with duration filter

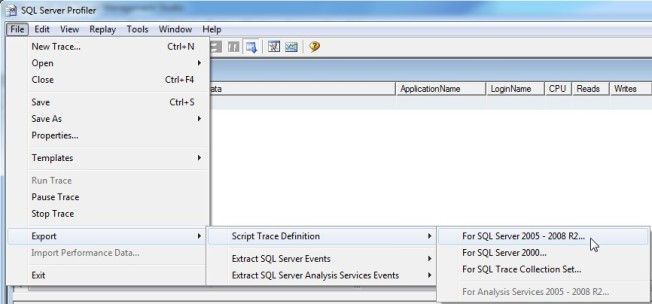
Run the trace, then you can export it to a script.  I’m not happy that you have to run it first, but in the end this is either something that doesn’t affect the server at all or something I run on a dev server that’s at the same patch level.

Export trace to file

There, you have the basic script to start the server-side trace.  You still need to tweak it a bit before you can use it, but the hard part is done.  Everything highlighted in yellow was changed by me.  The default max file size was changed from 5 MB to 25 MB because I view 25 to 50 MB to be the range that’s not annoyingly small or too big to move around or send to someone easily.  The second parameter of sp_trace_create is set to 2 to enable rollover files, the third parameter is set to my output file sans an extension, and the last parameter is added to say how many output files there are.

/****************************************************/
/* Created by: SQL Server 2008 R2 Profiler          */
/* Date: 06/16/2013  06:10:02 AM         */
/****************************************************/

-- Create a Queue
declare @rc int
declare @TraceID int
declare @maxfilesize bigint
set @maxfilesize = 25

-- Please replace the text InsertFileNameHere, with an appropriate
-- filename prefixed by a path, e.g., c:\MyFolder\MyTrace. The .trc extension
-- will be appended to the filename automatically. If you are writing from
-- remote server to local drive, please use UNC path and make sure server has
-- write access to your network share

exec @rc = sp_trace_create @TraceID output, 2, N'D:\Traces\DurationOver10Sec', @maxfilesize, NULL, 5
if (@rc != 0) goto error

-- Client side File and Table cannot be scripted

-- Set the events
declare @on bit
set @on = 1
exec sp_trace_setevent @TraceID, 10, 15, @on
exec sp_trace_setevent @TraceID, 10, 31, @on
exec sp_trace_setevent @TraceID, 10, 8, @on
exec sp_trace_setevent @TraceID, 10, 16, @on
exec sp_trace_setevent @TraceID, 10, 48, @on
exec sp_trace_setevent @TraceID, 10, 1, @on
exec sp_trace_setevent @TraceID, 10, 9, @on
exec sp_trace_setevent @TraceID, 10, 17, @on
exec sp_trace_setevent @TraceID, 10, 10, @on
exec sp_trace_setevent @TraceID, 10, 18, @on
exec sp_trace_setevent @TraceID, 10, 34, @on
exec sp_trace_setevent @TraceID, 10, 3, @on
exec sp_trace_setevent @TraceID, 10, 11, @on
exec sp_trace_setevent @TraceID, 10, 51, @on
exec sp_trace_setevent @TraceID, 10, 12, @on
exec sp_trace_setevent @TraceID, 10, 13, @on
exec sp_trace_setevent @TraceID, 10, 14, @on
exec sp_trace_setevent @TraceID, 12, 15, @on
exec sp_trace_setevent @TraceID, 12, 31, @on
exec sp_trace_setevent @TraceID, 12, 8, @on
exec sp_trace_setevent @TraceID, 12, 16, @on
exec sp_trace_setevent @TraceID, 12, 48, @on
exec sp_trace_setevent @TraceID, 12, 1, @on
exec sp_trace_setevent @TraceID, 12, 9, @on
exec sp_trace_setevent @TraceID, 12, 17, @on
exec sp_trace_setevent @TraceID, 12, 10, @on
exec sp_trace_setevent @TraceID, 12, 14, @on
exec sp_trace_setevent @TraceID, 12, 18, @on
exec sp_trace_setevent @TraceID, 12, 3, @on
exec sp_trace_setevent @TraceID, 12, 11, @on
exec sp_trace_setevent @TraceID, 12, 51, @on
exec sp_trace_setevent @TraceID, 12, 12, @on
exec sp_trace_setevent @TraceID, 12, 13, @on

-- Set the Filters
declare @intfilter int
declare @bigintfilter bigint

set @bigintfilter = 10000000
exec sp_trace_setfilter @TraceID, 13, 0, 4, @bigintfilter

-- Set the trace status to start
exec sp_trace_setstatus @TraceID, 1

-- display trace id for future references
select TraceID=@TraceID
goto finish

error: 
select ErrorCode=@rc

finish: 
go

This is done as a server-side trace for a couple reasons. Profiler needs to stay open to keep collecting data, SQL Server has to send the data to Profiler which is usually across the network, then the trace data is held in memory. None of these are a problem for a properly filtered short-term trace. This is properly filtered, but I’m really hoping everyone will run this long-term.

I owe you another blog post on querying traces, then we can move in to putting it all together with where to start when a user makes their favorite statement to you…”The server is running slow”.