When I get alerts from SQL Server I want it to do three things for me. Tell me what’s wrong, show me the data, then tell me how to take action on that data. Unfortunately, SQL doesn’t have a great way of showing the data unless you want to parse it into text by yourself or click on an attachment to view a text document of query results.
Start with the punchline
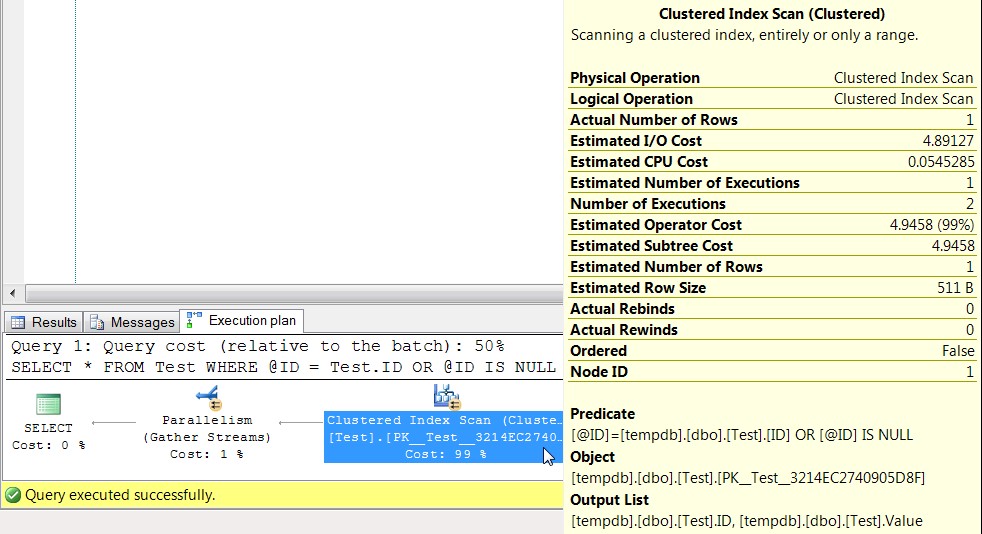
Here is an example email I have going out, with the subject “Backups are not current on <servername>”:

I can quickly see that my full backups didn’t run last night for some reason, and since I don’t have a job failure email that preceded this I can guess that the job never ran. On this server we used to do differential backups, but got away from doing them a couple years ago. The reason for that is top secret, but what is no longer a secret is that these database aren’t new and don’t have a recent full or differential backup.
How I got to that punchline:
First I found the Stack Overflow question Convert a SQL query result table to an HTML table for email, which did the hard part I’ve never done before. Getting that to flow well in an easy-to-use format wasn’t overly difficult, but a bit tedious. First thing was to put the query to HTML into a proc:
CREATE PROC proc_Query_To_HTML
	@Query nvarchar(max)
	, @OrderBy nvarchar(1000) = NULL
	, @HTML nvarchar(max) OUTPUT
AS

/*
--USAGE: Two calls, one with the optional @OrderBy.  Uses a tiny temp table to make the results easy to read.
--WARNING: Query will be called in the context of the DBA database.  Use fully-qualified names such as master.sys.tables to get data from another database.

DECLARE @HTML nvarchar(max)

IF OBJECT_ID('tempdb..#x') IS NOT NULL DROP TABLE #x

CREATE TABLE #x (mynumba int)
INSERT INTO #x SELECT 1 UNION ALL SELECT 5

EXEC DBA.dbo.proc_Query_To_HTML
	@Query = 'SELECT * FROM #x'
	, @HTML = @HTML OUTPUT

SELECT @HTML

EXEC DBA.dbo.proc_Query_To_HTML
	@Query = 'SELECT * FROM #x'
	, @OrderBy = 'ORDER BY mynumba DESC'
	, @HTML = @HTML OUTPUT

SELECT @HTML
*/

IF @OrderBy IS NULL BEGIN
	SET @OrderBy = ''
END

SET @OrderBy = REPLACE(@OrderBy, '''', '''''');

DECLARE @RealQuery nvarchar(MAX) = CAST('' as nvarchar(max)) + '
DECLARE @headerRow nvarchar(MAX);
DECLARE @cols nvarchar(MAX);
DECLARE @Message varchar(1000) = ''''

SELECT * INTO #dynSql FROM (' + @Query + ') sub;

SELECT @cols = COALESCE(@cols + '', '''''''', '', '''') + ''['' + name + ''] AS ''''td''''''
FROM tempdb.sys.columns
WHERE object_id = object_id(''tempdb..#dynSql'')
ORDER BY column_id;

SET @cols = ''SET @html = CAST(( SELECT '' + @cols + '' FROM #dynSql ' + @OrderBy + ' FOR XML PATH(''''tr''''), ELEMENTS XSINIL) AS nvarchar(max))''

EXEC sys.sp_executesql @cols, N''@html nvarchar(MAX) OUTPUT'', @html=@html OUTPUT

SELECT @headerRow = COALESCE(@headerRow + '''', '''') + ''<th>'' + name + ''</th>''
FROM tempdb.sys.columns
WHERE object_id = object_id(''tempdb..#dynSql'')
ORDER BY column_id;

SET @headerRow = ''<tr>'' + @headerRow + ''</tr>'';

SET @html = ''<table border="1">'' + @headerRow + @html + ''</table>'';

IF @Message IS NOT NULL BEGIN
	SELECT @html = @message + char(10) + char(10) + @html
END
';

EXEC sys.sp_executesql @RealQuery, N'@html nvarchar(MAX) OUTPUT', @html=@HTML OUTPUT
Now I have something spitting out an HTML table, and I love it. It’s a bit of a pain to use, but I’ll piece together an email alert when I really need it and I can make it look nice. Ok, that was painful to say, so I made this proc that calls the previous one.
CREATE PROCEDURE proc_Query_To_Email
	@Subject nvarchar(max) = 'required'
	, @Recipients nvarchar(max) = 'required'
	, @CopyRecipients nvarchar(max) = NULL
	, @BlindCopyRecipients nvarchar(max) = NULL
	, @From_Name varchar(max) = NULL
	, @From_Address varchar(max) = NULL
	, @Reply_To varchar(max) = NULL
	, @Reply_To_Same_As_From bit = 1
	, @BodyIntro nvarchar(max) = NULL
	, @BodyAfterQuery1 nvarchar(max) = NULL
	, @BodyAfterQuery2 nvarchar(max) = NULL
	, @BodyAfterQuery3 nvarchar(max) = NULL
	, @BodyAfterQuery4 nvarchar(max) = NULL
	, @BodyEnding nvarchar(max) = NULL
	, @Query1 nvarchar(max) = 'required'
	, @OrderBy1 nvarchar(max) = NULL
	, @Query2 nvarchar(max) = NULL
	, @OrderBy2 nvarchar(max) = NULL
	, @Query3 nvarchar(max) = NULL
	, @OrderBy3 nvarchar(max) = NULL
	, @Query4 nvarchar(max) = NULL
	, @OrderBy4 nvarchar(max) = NULL
	, @Query5 nvarchar(max) = NULL
	, @OrderBy5 nvarchar(max) = NULL
	, @ShowOrigin bit = 1
	, @SendOnlyIfQuery1HasResults bit = 1
	, @SendOnlyIfQuery2HasResults bit = 0
	, @EmailProfile nvarchar(max) = NULL
AS

IF @Subject = 'required' OR @Recipients = 'required' OR @Query1 = 'required' BEGIN
PRINT '
***IMPORTANT*** The query will run in the scope of the database this proc is created in.  Use qualified names for tables giving the database name such as msdb.dbo.sysjobs.

Required parameters:
	@Subject
	, @Recipients
	, @Query1

Ideal parameters:
	@Subject
	, @Recipients
	, @BodyIntro - Describe the result set
	, @Query1
	, @OrderBy - Sorted results are usually easier to read
	, @BodyEnding - Let them (or you) know how to react to these results.  If it''s infrequent then you''ll forget.

Basic Usage:
EXEC DBA..proc_Query_To_Email
	@Subject = ''SQL Server not rebooted recently''
	, @Recipients = ''steve.hood@notmydomain.com''
	, @BodyIntro = ''This server wasn''''t rebooted in the last 40 days:''
	, @Query1 = ''SELECT last_reboot = create_date FROM master.sys.databases where name = ''''tempdb'''' AND create_date < GETDATE()-40''
	, @OrderBy1 = ''ORDER BY last_reboot''
	, @BodyEnding = ''All SQL Servers should be rebooted each month during monthly maintenance.  Please make sure this server is set up properly to do regular maintenance.''

The body of the email will consist of the following, and all are optional unless one of the @SendOnlyIf... variables is set to 1:
	@BodyIntro
	+ @Query1 results
	+ @BodyAfterQuery1
	+ @Query2 results
	+ @BodyEnding
	+ What called this proc if @ShowOrigin = 1

All parts of the body will accept HTML tags.  <br><br> will separate text into paragraphs.

All parameters - It''s overwhelming, but only @Subject, @Recipients, and @Query1 are required.  @BodyIntro and @BodyEnding are strongly recommended:
	@Subject - Email subject
	, @Recipients - Email recipients, semicolon delimited
	, @CopyRecipients - Email copy recipients, semicolon delimited
	, @BlindCopyRecipients - BCC recipients, semicolon delimited
	, @From_Name - Name of the person the email is coming from (defaults to the SQL Server''s name)  Only works if @From_Address is set.
	, @From_Address - Email address the email is coming from (defaults to the SQL Server profile''s email address)
	, @Reply_To - Who receives the email when you hit reply (defaults to From_Address, which defaults to the profile email address)
	, @Reply_To_Same_As_From - bit - If @Reply_To is left at null then it takes on the value of @From_Address (default is true)
	, @BodyIntro - First words on the email, usually introducing the query results
	, @BodyAfterQuery1 - Typically not used unless there are two queries.  Would introduce second query results
	, @BodyAfterQuery2 - Typically not used unless there are three queries.  Would introduce third query results
	, @BodyAfterQuery3 - Typically not used unless there are four queries.  Would introduce fourth query results
	, @BodyAfterQuery4 - Typically not used unless there are five queries.  Would introduce fifth query results
	, @BodyEnding - Text immediately after queries
	, @Query1 - Query, needs database explicitly set - msdb.dbo.sysjobs instead of sysjobs
	, @OrderBy1 - Query1''s order by clause has to be separate due to the HTML formatter - "ORDER BY name"
	, @Query2 - Second query, typically not used.  Would be good to have query 1 show an issue and query 2 showing details
	, @OrderBy2 - Query2''s order by clause - "ORDER BY name"
	, @Query3 - Typically not used
	, @OrderBy3 - Typically not used
	, @Query4 - Typically not used
	, @OrderBy4 - Typically not used
	, @Query5 - Typically not used
	, @OrderBy5 - Typically not used
	, @ShowOrigin - bit - End email by showing computer name that called this proc.  If it was called by a SQL Agent job then end the email with what job and job step, too (default is true)
	, @SendOnlyIfQuery1HasResults - bit - If query1 doesn''t return results or fails then don''t send the email (default is true)
	, @SendOnlyIfQuery2HasResults - bit - If query2 doesn''t return results or fails then don''t send the email (default is false)
	, @EmailProfile - If you need to use a non-default email profile then put the name here - Typically not used if there''s a default profile
'
	RETURN;
END

DECLARE @JobName nvarchar(max)
	, @Body nvarchar(max)
	, @HTML1 nvarchar(max)
	, @HTML2 nvarchar(max)
	, @HTML3 nvarchar(max)
	, @HTML4 nvarchar(max)
	, @HTML5 nvarchar(max)

IF @Query1 IS NOT NULL BEGIN
	EXEC proc_Query_To_HTML
		@Query = @Query1
		, @OrderBy = @OrderBy1
		, @HTML = @HTML1 OUTPUT
END

IF @Query2 IS NOT NULL BEGIN
	EXEC proc_Query_To_HTML
		@Query = @Query2
		, @OrderBy = @OrderBy2
		, @HTML = @HTML2 OUTPUT
END

IF @Query3 IS NOT NULL BEGIN
	EXEC proc_Query_To_HTML
		@Query = @Query3
		, @OrderBy = @OrderBy3
		, @HTML = @HTML3 OUTPUT
END

IF @Query4 IS NOT NULL BEGIN
	EXEC proc_Query_To_HTML
		@Query = @Query4
		, @OrderBy = @OrderBy4
		, @HTML = @HTML4 OUTPUT
END

IF @Query5 IS NOT NULL BEGIN
	EXEC proc_Query_To_HTML
		@Query = @Query5
		, @OrderBy = @OrderBy5
		, @HTML = @HTML5 OUTPUT
END

IF @ShowOrigin = 1 BEGIN
	SELECT @JobName = CASE LEFT(es.program_name, 29)
					WHEN 'SQLAgent - TSQL JobStep (Job '
						THEN 'SQL Agent Job: ' + (SELECT name FROM msdb..sysjobs sj WHERE substring(es.program_name,32,32)=(substring(sys.fn_varbintohexstr(sj.job_id),3,100))) + ' - ' + SUBSTRING(es.program_name, 67, len(es.program_name)-67)
					ELSE NULL
					END
	FROM sys.dm_exec_sessions es
	WHERE es.session_id = @@SPID

	IF @JobName IS NULL BEGIN --It wasn't sent by SQL Agent, so find the computer that called this proc.
		SELECT @JobName = HOST_NAME()
	END

	IF @JobName IS NOT NULL BEGIN
		SELECT @BodyEnding = ISNULL(@BodyEnding, '') + '<br><br>' + 'This email was sent by ' + @JobName + ' on ' + @@SERVERNAME
	END
END

IF @From_Address IS NOT NULL BEGIN
	IF @Reply_To IS NULL AND @Reply_To_Same_As_From = 1 BEGIN
		SELECT @Reply_To = @From_Address
	END

	IF @From_Name IS NOT NULL BEGIN
		SELECT @From_Address = @From_Name + ' <' + @From_Address + '>'
	END
END

IF @EmailProfile IS NULL AND 0 = (SELECT COUNT(1) FROM msdb.dbo.sysmail_principalprofile WHERE is_default = 1) BEGIN
	PRINT '@EmailProfile is required because Database Mail does not have a default profile set up.'
END ELSE IF (@SendOnlyIfQuery1HasResults = 1 AND @HTML1 IS NULL) OR (@SendOnlyIfQuery2HasResults = 1 AND @HTML2 IS NULL) BEGIN
	PRINT 'There are no results to send.'
END ELSE BEGIN
	SELECT @Body = CAST('' as nvarchar(max))
		+ ISNULL(@BodyIntro + '<br>', '')
		+ ISNULL(@HTML1, '')
		+ ISNULL('<br>' + @BodyAfterQuery1, '')
		+ ISNULL('<br>' + @HTML2, '')
		+ ISNULL('<br>' + @BodyAfterQuery2, '')
		+ ISNULL('<br>' + @HTML3, '')
		+ ISNULL('<br>' + @BodyAfterQuery3, '')
		+ ISNULL('<br>' + @HTML4, '')
		+ ISNULL('<br>' + @BodyAfterQuery4, '')
		+ ISNULL('<br>' + @HTML5, '')
		+ ISNULL('<br>' + @BodyEnding, '')

	EXEC msdb..sp_send_dbmail
		@recipients = @Recipients
		, @copy_recipients = @CopyRecipients
		, @blind_copy_recipients = @BlindCopyRecipients
		, @from_address = @From_Address
		, @reply_to = @Reply_To
		, @subject = @Subject
		, @body = @Body
		, @body_format = 'HTML'
		, @profile_name = @EmailProfile
END
How do I use this thing?
Ok, so I know this looks big and scary with lots of parameters. The three of them that are required to run it are only @Subject, @Recipients, and @Query1. The six I consider required to make something great also include @OrderBy1 (i.e. make it easy to read the query results), @BodyIntro (i.e. explain why they’re getting the email and what the query results are before they see them), and @BodyEnding (i.e. explain what action you’re hoping for the user to take).
A couple odd things, because everything about me has some odd things:
- By default, if @Query1 returns no results it prints “There were no results to send.” and no email goes out.
- @Query1 (and friends) can take normal #temp tables, you do not need ##global temp tables
- @OrderBy1 needs to start with “ORDER BY ” and uses the alias used in the select statement
- Notice my example for basic usage has “ORDER BY last_reboot” when the column in the table is “create_date”
Now, the first one of those odd things is my favorite odd thing ever. I’ll do my best to write an efficient query that only returns results when something bad happens, then I’ll create a SQL Agent job that runs somewhat frequently, and all it contains is a simple call to this proc. My basic usage example is perfect as an overly generic example I might have run every Friday morning where if TempDB is over 40 days old I’ll get an email, otherwise I’ll see the results on my job simply say “There were no results to send.”, and I won’t get an email.
EXEC DBA..proc_Query_To_Email
	@Subject = 'SQL Server not rebooted recently'
	, @Recipients = 'steve.hood@notmydomain.com'
	, @BodyIntro = 'This server wasn''t rebooted in the last 40 days:'
	, @Query1 = 'SELECT last_reboot = create_date FROM master.sys.databases where name = ''tempdb'' AND create_date < GETDATE()-40'
	, @OrderBy1 = 'ORDER BY last_reboot'
	, @BodyEnding = 'All SQL Servers should be rebooted each month during monthly maintenance.  Please make sure this server is set up properly to do regular maintenance.'
Now you have more complex needs than that, and so do I. I have processing queues that should never be more than 30 minutes behind, so I’ll pass in a query to give me the oldest 10 rows that are over 30 minutes old. Typically doesn’t have any results and I don’t get an email, but when it does it doesn’t flood my email while showing me what the oldest rows are. Then I might use @Query2 to give me a total count.
@BodyEnding is the big one for me. It’s not required to call this, but it’s practically required to be useful. In the last example I’m telling you the processing queue is over 30 minutes behind, and telling you I don’t think that’s cool. @BodyEnding is where I throw out instructions on how to fix it or at least how to start troubleshooting the issue. Even if this email is only going to me, I write this part like I’m talking to an intern, because I might be working on this at 3 AM where I’m slower than an intern or someone else might be handling this when I’m trying to take a day off.
If someone else asks me to make an alert and doesn’t give me instructions on how to fix it, @BodyEnding gets to be as sarcastic as I’m feeling that day. At one point an alert ended with “We don’t know what to do. Panic!!!”. This helped get someone else who was receiving the alerts to give me a small checklist to go through, and now that’s in @BodyEnding preceded by “Don’t panic, we know what to do:”.
An annoyed thinker may point out that I never talked about my screenshot again. What query was that, and how’d you do it? Well, this post has got to be around 2,238 words long, and I thought going into the weeds on that was going too far.
A quick thinker may realize that my screenshot of a real error message above didn’t have anything for @BodyEnding, and that’s because I’m not consistent. Anyways, I hope you enjoyed my first post in about a decade.