SQL Server tracing is essential for troubleshooting performance issues, yet it can put loads on your server that would cause noticeable slowness, capture so much information that it fills the drive, and I’ve even seen it cause a cluster failover more than once. With a tool this powerful you just need to know how to use it before you use it. It’s almost like the idea where companies want their entry-level people to have a year of experience.
There is one trace I’d like to see on every server, preferably as a startup proc or a job that starts automatically when SQL Agent starts. It doesn’t matter how you do it, if you want me to be happy you’ll tell me this was running for at least 24 hours before you had a performance incident. All I’m looking for is RPC:Completed and SQL:BatchCompleted with a reasonable filter of duration over 10 seconds.
If you’ve never used Profiler before, here’s a quick overview to make the server-side trace I’m using. Leave the first screen at the defaults, with the possible exception of changing the template to blank. Select RPC:Completed and SQL:BatchCompleted and set the Duration filter to greater than or equal to 10,000 ms which you can get to using the “Column Filters…” button. You can collect all columns if you want to, it won’t hurt with these events although there are some columns that won’t help.
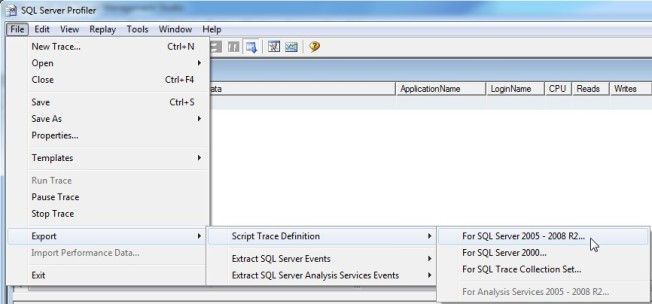
Run the trace, then you can export it to a script. I’m not happy that you have to run it first, but in the end this is either something that doesn’t affect the server at all or something I run on a dev server that’s at the same patch level.
There, you have the basic script to start the server-side trace. You still need to tweak it a bit before you can use it, but the hard part is done. Everything highlighted in yellow was changed by me. The default max file size was changed from 5 MB to 25 MB because I view 25 to 50 MB to be the range that’s not annoyingly small or too big to move around or send to someone easily. The second parameter of sp_trace_create is set to 2 to enable rollover files, the third parameter is set to my output file sans an extension, and the last parameter is added to say how many output files there are.
/****************************************************/
/* Created by: SQL Server 2008 R2 Profiler          */
/* Date: 06/16/2013  06:10:02 AM         */
/****************************************************/

-- Create a Queue
declare @rc int
declare @TraceID int
declare @maxfilesize bigint
set @maxfilesize = 25

-- Please replace the text InsertFileNameHere, with an appropriate
-- filename prefixed by a path, e.g., c:\MyFolder\MyTrace. The .trc extension
-- will be appended to the filename automatically. If you are writing from
-- remote server to local drive, please use UNC path and make sure server has
-- write access to your network share

exec @rc = sp_trace_create @TraceID output, 2, N'D:\Traces\DurationOver10Sec', @maxfilesize, NULL, 5
if (@rc != 0) goto error

-- Client side File and Table cannot be scripted

-- Set the events
declare @on bit
set @on = 1
exec sp_trace_setevent @TraceID, 10, 15, @on
exec sp_trace_setevent @TraceID, 10, 31, @on
exec sp_trace_setevent @TraceID, 10, 8, @on
exec sp_trace_setevent @TraceID, 10, 16, @on
exec sp_trace_setevent @TraceID, 10, 48, @on
exec sp_trace_setevent @TraceID, 10, 1, @on
exec sp_trace_setevent @TraceID, 10, 9, @on
exec sp_trace_setevent @TraceID, 10, 17, @on
exec sp_trace_setevent @TraceID, 10, 10, @on
exec sp_trace_setevent @TraceID, 10, 18, @on
exec sp_trace_setevent @TraceID, 10, 34, @on
exec sp_trace_setevent @TraceID, 10, 3, @on
exec sp_trace_setevent @TraceID, 10, 11, @on
exec sp_trace_setevent @TraceID, 10, 51, @on
exec sp_trace_setevent @TraceID, 10, 12, @on
exec sp_trace_setevent @TraceID, 10, 13, @on
exec sp_trace_setevent @TraceID, 10, 14, @on
exec sp_trace_setevent @TraceID, 12, 15, @on
exec sp_trace_setevent @TraceID, 12, 31, @on
exec sp_trace_setevent @TraceID, 12, 8, @on
exec sp_trace_setevent @TraceID, 12, 16, @on
exec sp_trace_setevent @TraceID, 12, 48, @on
exec sp_trace_setevent @TraceID, 12, 1, @on
exec sp_trace_setevent @TraceID, 12, 9, @on
exec sp_trace_setevent @TraceID, 12, 17, @on
exec sp_trace_setevent @TraceID, 12, 10, @on
exec sp_trace_setevent @TraceID, 12, 14, @on
exec sp_trace_setevent @TraceID, 12, 18, @on
exec sp_trace_setevent @TraceID, 12, 3, @on
exec sp_trace_setevent @TraceID, 12, 11, @on
exec sp_trace_setevent @TraceID, 12, 51, @on
exec sp_trace_setevent @TraceID, 12, 12, @on
exec sp_trace_setevent @TraceID, 12, 13, @on

-- Set the Filters
declare @intfilter int
declare @bigintfilter bigint

set @bigintfilter = 10000000
exec sp_trace_setfilter @TraceID, 13, 0, 4, @bigintfilter

-- Set the trace status to start
exec sp_trace_setstatus @TraceID, 1

-- display trace id for future references
select TraceID=@TraceID
goto finish

error:
select ErrorCode=@rc

finish:
go
This is done as a server-side trace for a couple reasons. Profiler needs to stay open to keep collecting data, SQL Server has to send the data to Profiler which is usually across the network, then the trace data is held in memory. None of these are a problem for a properly filtered short-term trace. This is properly filtered, but I’m really hoping everyone will run this long-term.
I owe you another blog post on querying traces, then we can move in to putting it all together with where to start when a user makes their favorite statement to you…”The server is running slow”.
Related articles
- Reading Traces (simplesqlserver.com)
- SQL Server Running Slow (simplesqlserver.com)

