I see TempDB using more memory than I feel it should and found a way to resolve it. Previously I dove into technical details and questioning what I saw in my post TempDB Memory Leak? which is great for proving and debugging an issue. Now I want to step back and talk about it from a practical perspective.
To keep it practical, I’m going to walk through a single server, step-by-step. What I saw that caught my eye and how I applied my workaround. This is a real, production server with screen shots from Idera Diagnostic Manager for both before and after comparisons.
What I’m Seeing
A large portion of my buffer pool is being utilized by TempDB pages which are unallocated on disk. The easiest way to see this is this quick query:
SELECT Unallocated_MB = COUNT(1)/128
FROM sys.dm_os_buffer_descriptors bd
	LEFT JOIN sys.allocation_units au ON bd.allocation_unit_id = au.allocation_unit_id
WHERE bd.database_id = 2
	AND au.allocation_unit_id IS NULL
The details of everything in memory can be seen on my post Query the Buffer Pool.
Since these are all pointing to real, but unallocated TempDB pages on disk, I was able to develop a workaround of simply having fewer TempDB pages on disk. AKA, I made TempDB data files smaller.
Sizing TempDB
Here we’re talking about being hurt by TempDB being too large, but we can’t lose sight of TempDB being too small hurting you as well. Specifically, when your server is the busiest with a small TempDB it will have to stop and grow the files, then deal with any fragmentation that process caused. So, while I’m not going to recommend filling your dedicated drive, I’m not going to recommend making TempDB tiny, either.
My recommendation is to monitor your server, find out how much space TempDB uses, and make your TempDB significantly larger than that. The longer you have watched your server, the better. The goal is still to avoid almost any growth possible, but I’m adding in a “don’t go crazy” clause.
You can do this yourself as I talked about in Monitoring Database and Table Sizes using the function call FileProperty(<filename>, ‘space used’). If you do it this way, make sure you have this running for a minimum of several weeks at least once an hour, day and night. It’s possible, not difficult to do, and not recommended for servers that have a reasonable monitoring system already in place.
If you’re doing this to your production servers you should already have monitoring software that’s watching file sizes for you, even if it’s only tracking this in the background with no obvious way to find the information in the GUI. This is the situation I find myself in using Idera Diagnostic Manager. The data’s there, but the GUI is set up for more immediate concerns. I need this query to get what I want out of it.
SELECT TOP 100 S.InstanceName
	, DS.UTCCollectionDateTime
	, D.DatabaseName
	, DataUsed_GB = CAST((DataSizeInKilobytes + IndexSizeInKilobytes) / 1024 / 1024.0 AS DEC(20,1))
	, LogUsed_GB = CAST(LogSizeInKilobytes / 1024 / 1024.0 AS DEC(20,1))
FROM SQLdmRepository.dbo.DatabaseSize DS
	INNER JOIN SQLdmRepository.dbo.SQLServerDatabaseNames D ON DS.DatabaseID = D.DatabaseID
	INNER JOIN SQLdmRepository.dbo.MonitoredSQLServers S ON S.SQLServerID = D.SQLServerID
WHERE UPPER(S.InstanceName) = 'SERVER\INSTANCE'
	AND D.DatabaseName = 'tempdb'
	AND UTCCollectionDateTime > GetUTCDate()-180
ORDER BY 4 DESC
My recommendation is to take the peak size outside of a one-time process and make the total TempDB data files at least 150% of that size. If you have 4 TempDB data files and the peak size used is 4 GB, 150% of that is 6 GB, so make each file at least 1.5 GB. Then set autogrowth to something reasonable because one-time processes will happen.
My Before Observations
All of the screen shots and trending information are from Idera Diagnostic Manger, but you should be able to get the same basic information out of any monitoring software.
I had a server with rather low PLE and a lot of physical I/O.
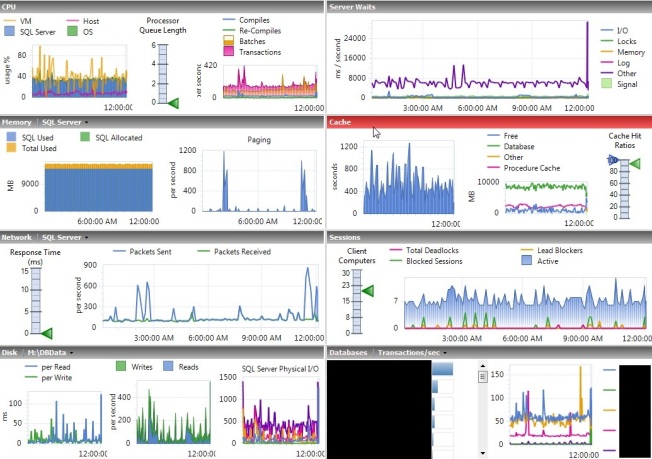
The physical I/O is difficult to see here because this server has a lot of writes. When you look closer you can see that it rather regularly went to 400 page reads per second.

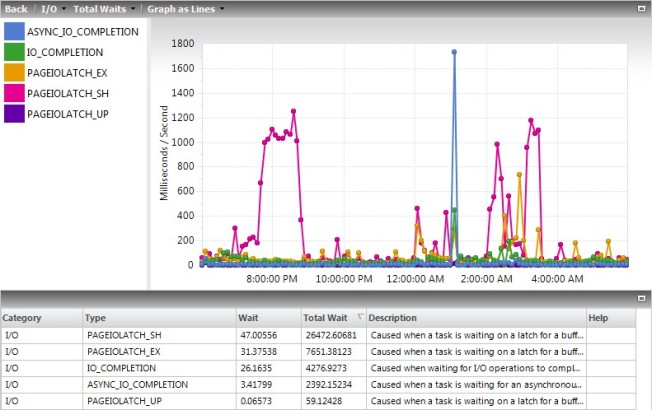
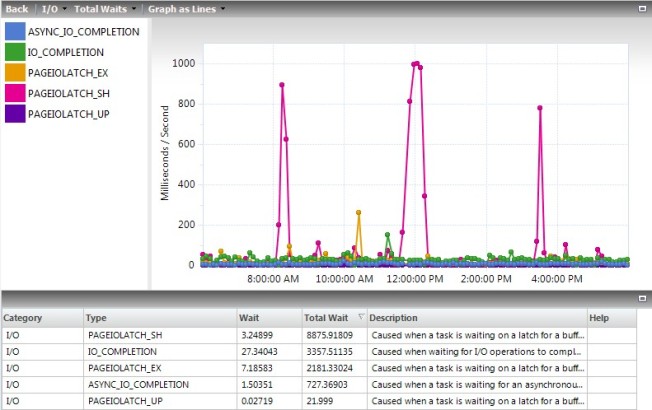
All of those reads caused lots of waits on the server. In my 12-hour sample period I saw a total of 34,000. The units shown for this field are fine for comparison reasons, but they appear to be a total of the ms/s on the chart for values collected every 6 minutes, not the total waits. You have to query the tables behind Idera Diagnostic Manager to get the real values. In this case, the total waits were 138 minutes for shared and 49 for exclusive latches, for a total of 187 minutes of waiting for the 12 hours.
Just seeing this I wanted to request more memory on the VM, after all it only had 16 GB. However, I made it a rule to never add memory without justifying what’s in memory first. To do that, I used my query on Query the Buffer Pool, and this was the first line in the results:

Of the 8.5 GB of memory used by the buffer pool, about 6 GB of that was used by unallocated space in TempDB. I can accept some because of how TempDB caches temp tables and other stuff, but to have 70% of the buffer pool used up while I’m seeing low PLE and high I/O is not acceptable.
My Fix
I had the files set to practically fill the dedicated drive according to best practices, so each of the 4 files was 7,000 MB adding up to almost 28 GB on a 30 GB drive.
Using the query in the Sizing TempDB section above, this server has never used more than 1 GB of data in TempDB at one time. While that makes for some interesting questions on how it’s using 6 GB of cache, it does give me a lot of room to reduce the size.
There were no complaints about performance due to what this server is being used for, so I didn’t try to shrink TempDB. Instead I took the patient approach an resized TempDB, which took effect the next time SQL Services restarted. Then I waited for our scheduled server reboots for Windows Updates.
ALTER DATABASE [tempdb] MODIFY FILE ( NAME = N'tempdev',SIZE = 512MB , FILEGROWTH = 128MB )
ALTER DATABASE [tempdb] MODIFY FILE ( NAME = N'tempdev2',SIZE = 512MB , FILEGROWTH = 128MB )
ALTER DATABASE [tempdb] MODIFY FILE ( NAME = N'tempdev3',SIZE = 512MB , FILEGROWTH = 128MB )
ALTER DATABASE [tempdb] MODIFY FILE ( NAME = N'tempdev4',SIZE = 512MB , FILEGROWTH = 128MB )
Note that my recommendation above would have been to make the files at least 1.5 GB and I made them 2 GB here. I’m not worried about exact numbers, I’m worried about being reasonable sizes that also avoid growths. With peak observed usage at 1 GB and TempDB sized at 2 GB, any growths should be very rare.
Overall, the data files will grow at 512 MB at a time, which, when it happens, is large enough to avoid extreme fragmentation yet small enough to avoid extreme waits. This should only happen during “I didn’t mean to do that” or “how’d it get that execution plan” moments, but it will happen.
My After Observations
After the change I waited a couple days to let the cache stabilize after a reboot. We rebooted on Saturday, and all of these numbers are from the Tuesday after.
When I looked again, TempDB was using 1/10 of the space it was before for unallocated pages in memory. It’s not perfect, but it’s much better.

TempDB using less cache allowed PLE be a lot more stable, regularly staying well above 2,000. Using Jonathan Kehayias’s formula, PLE should be above 1,050 on a server with 14 GB of cache, so this is looking good.
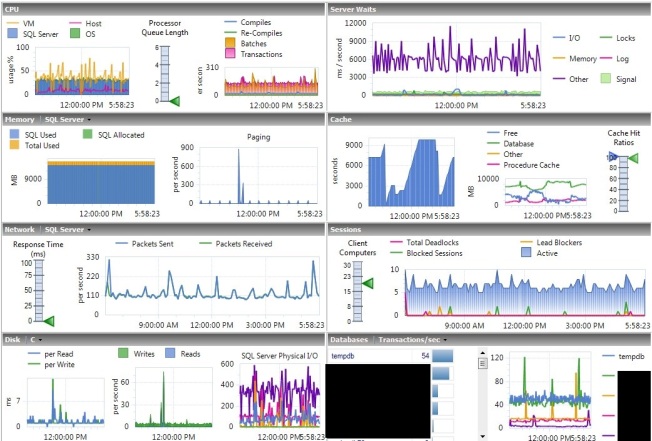
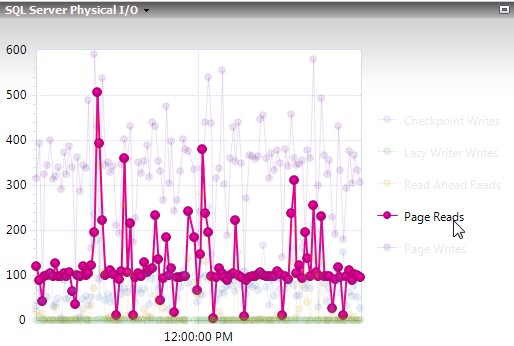
With data staying in cache more, physical I/O also dropped. Before it was normal to see spikes to 400 page reads per second, now you’re seeing about half of that.
Less activity also meant less waits. The couple spikes still went almost as high, but those are things you’ll fix more through tuning than memory management. The totals at the bottom are what I’m focused on right now, the PageIOLatch_xx waits combined added up to about 11,000 for the day, so about 1/3 of what it was before.
Again, I don’t like how Idera Diagnostic Manager calculates the totals. When I queried the tables I saw that there was 60 minutes of waits on shared latches and 13 minutes on exclusive latches, for a total of 73 minutes. This is in comparison to 138 + 49 = 187 minutes before.
The Downside
Even with the new, smaller size, TempDB is a lot larger than it needs to be so it would be very rare to see any growths in the near future. However, I have to keep in mind that the load on my servers will always be increasing, so I may end up hitting autogrowth down the road. Then I’ll reboot the servers each month with Windows Updates, it’ll shrink TempDB back down for me, and it will have to grow again the next month.
Because of this, I’ll need to visit every one of my servers from time to time (semi-annually?) to see if this is occurring and increase the size of TempDB if it is. I’ll use the same script for determining the peak sizes because I have software that’s capturing that already, but I could find other methods to get that information if I needed to.
The only other downside I see is with servers that hit a high peak TempDB usage overnight then never come close to it again during the day. This workaround won’t do much for those servers. You need that space overnight, so trying to make the size smaller than what it needs at 2 AM will just make everything worse. However, knowing about this will drive you nuts enough to look into the overnight processes to see if you can lower peak usage. Perhaps you can spread out some concurrent tasks or tune some bad queries that never mattered due to their timing. It’s not a bad thing to do this work, it’s just that this probably wasn’t a good time for something to climb up your priority list.
Take a Look
Take a look at your servers. How much cache is TempDB using? Does TempDB ever even use half of the space allocated to it? Is it causing issues on your servers?
Never make a change just because you saw someone say it’s a good idea, especially if they’ve never seen your servers before. Look at the numbers on your servers for yourself, ask questions to understand it, and make the best decision for those specific servers.
If you do make this change, check TempDB before your next reboot. Did it have to grow? If it did, you need to change the size manually so it doesn’t have to hit an autogrowth every month. If you shrunk it down to 2 GB total then it grew to 2.5 GB, consider making it 3.5 GB to avoid future growths while keeping the files reasonably sized.
If this was an issue on your servers and you feel SQL Server shouldn’t have functioned this way, please visit the Connect Item on this. An up-vote is great, a comment or anything else is even better.
Pingback: SQL Server – Tempdb – v2012 | Learning in the Open