Recompile Monitoring using XEvents

Recompiles can be a hidden bottleneck on your server, and it may not be too obvious.  I should know, it happened to me.  Unfortunately for me, that was before I was a proponent of tracing or using XEvents to watch for recompiles.  Fortunately for you, the experience changed me, and I enjoy sharing my experiences.

What happened to me was a proc that was called WAY too often was taking too long cumulatively.  I knew the true root cause of my issue was in the application which was calling the proc once per row, often for about hundred rows, when loading a pretty important page on a web application.  However, I just found out the service desk has been getting complaints for a while, and asking the development team to help me rewrite how the page works ended in an answer that didn’t even sound like now.  Well, I guess “no” does kinda sound like “now”…

The proc was pretty simple, taking on average about 0.150 seconds to run.  Sounds great until you remember that it’s being called about a hundred times for a page load on a web application.  100 * 0.15 = 15 seconds for the page to load, not counting anything else running.  Users were threatening to not be users anymore even though they were happy with most other aspects.

I got into it, reworded the query a little, created a perfect index for it, and it got it down to 0.100 seconds to run.  This was a large concession on my part because I HATE perfect indexes for a single query, and feel strongly that indexes should focus more on being reusable by many queries.  However, even that only got the web page to load in 10 seconds.

Traces of the proc confused me.  The statements were running in 0.010 seconds, and there was a 0.090 second gap between runs.  That gap was 9 of my 10 seconds.  At 10 seconds users avoid a website, but at 1 second users have to be prompted to say it’s not as fast as they’d like.

It took me longer than I’d like to admit to figure out that every run was kicking off a recompile that took 0.090 seconds.  This is the point where I started tracing for the recompile reason, and found out it was because statistics were being updated.  However, there were no stats in my database that were updated in the last 15 minutes, so I would have never guessed this was the reason without tracing on this event.

This proc loaded data into a temp table, then did some processing on that temp table, and I figured out that there were enough rows being loaded into the temp table to update the stats on it.  Removing the temp table was a disaster, it raised my execution time by 0.010 seconds.  Yeah, “disaster” can be relative…

Then I came up with a very odd solution that I’ve never seen or heard of before that point, and I haven’t used much since that point.  The temp table was swapped out for a table variable.  No stats to be updated, so no recompile.  Although it assumed there would only be one record in the table variable (it always does), the execution plan was the same.  The only difference was the total 0.100 second duration was dropped to 0.010 after losing the 0.090 recompile.

User experience was now a web page that loaded up in just over 1 second, with most of it still being this query.  There wasn’t anything more I could do except wait until the page could be rewritten by development where I could rewrite it to get all the results at once.  That process took time, and customers were not impatiently watching to see when it would happen.

I wrote this talking about the users, and users care about duration.  However, that’s not the whole story.  The 0.090 recompile was pure CPU time, it happening 100 times per page call added up to 9 seconds of pure CPU time, and the users having to use this page hundreds of times a day added up to a noticeable impact on the server performance when it went away.  Now I admit that the users only used this when they HAD to instead of when they should have, so it was balanced out a little by the users opening the page about twice as often.  Even then, it was still obvious that it was gone when comparing long-term CPU usage.

The Management Response

Side note for all of you managers out there…  My manager pulled me aside the next week saying “step into my office for a second.”.  I admit, that statement always makes you nervous, even when you KNOW everything is going great.  He proceeded to tell me that before I started with the company they pulled developers and a DBA into a task force that spent tons of money to improve performance, upgrading servers, upgrading the SAN, upping the WAN speed, and looking into the database.  Then he said that I did more in one day than they did in 6 months without spending any money, and that I should take my wife out for a nice dinner and bring him the receipt.

Now I know that the hardware upgrades helped out, that I only helped a single process that day, and many other things that could belittle what happened.  I also know that spending $100 was very minor in terms of the effect that change made for the company.  That’s not how I saw things.

What I saw was a response that stuck with me, a lot.  Management stepped back to recognize a difference someone made, and made sure they knew they were appreciated.  Then took it a step further bringing the family into it, having my wife feeling proud and appreciated at the same time.

I know the constraints management is under and all the things they can’t do.  That being said, the only thing that frustrates me about this situation is that I don’t see others in management taking the same approach.  I swore from that point that if I ever became a manager my one odd request would be that I would want a very small budget in writing to use at my digression.  Small things to show appreciation go a long way.

My Challenge

The challenging part for me, and where I felt I didn’t do as well as I should have done, is that this flew under my radar.  I was tracing for anything that took over 1 second duration and was looking at the most expensive queries all the time.  However, this one took 0.150 seconds and never accumulated time in the plan cache due to the recompiles.

Here’s the thing, I pride myself on being specialized in database performance, so I feel I should have seen this before having someone in customer service casually mention it to me in conversation.  It wasn’t even a request to look into it, just mentioning he just got off a call with the customer about the page, and that the page never worked right with no one being able to fix it.

After finding and resolving the root cause of the proc, I also wanted to find and resolve how this flew under my radar.  This came up to two primary responses.  First, the page was taking too long as a whole, so I requested stats on a per-page basis – how long it took to load each time and how long cumulatively.  Second, I started watching for recompiles from time to time.  Either one of these would have led me to this issue well before that point.

This post is not about monitoring performance on a website, so, although it’s a very important thing to do, I won’t be mentioning that part again.

Monitoring Recompiles

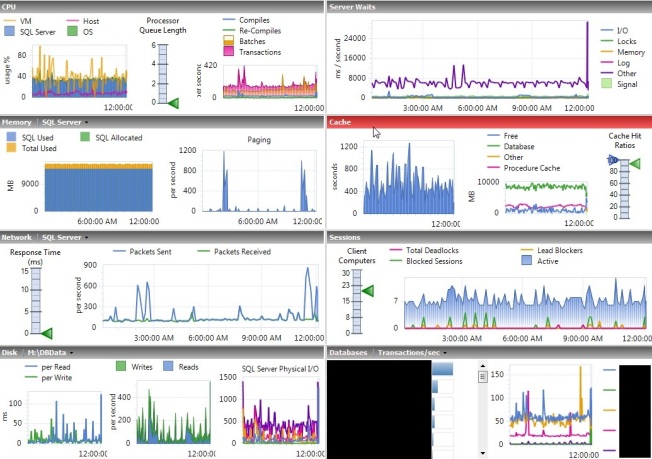
This post is about recompiles, how they can drag you down, and how you can find out about them.  I covered how they drug me down, and in past posts I casually mentioned you should use server-side traces or XEvents to monitor them.  Then I left it up to you to figure out how.  Lets try a different approach today.

Recompiles aren’t something I’m watching for constantly, so I’m not going to run any kind of monitoring constantly for them.  What I’ll do is run an XEvent session for 24 hours and analyze what it picked up.  If it didn’t recompile often that day it almost definitely does not belong on my priority list, so this works for me.

Here’s my session.  It starts immediately, writes to five 10MB rollover files, and will not start the next time your services restart.

IF EXISTS (SELECT 1 FROM sys.server_event_sessions WHERE name = 'Recompiles')
	DROP EVENT SESSION [Recompiles] ON SERVER;
GO

CREATE EVENT SESSION [Recompiles] ON SERVER 
ADD EVENT sqlserver.sql_statement_recompile
(	SET collect_object_name=(1)
		, collect_statement=(1)
	ACTION
		(sqlserver.database_id
			, sqlserver.database_name
			, sqlserver.session_id
			, sqlserver.sql_text
			, sqlserver.username))
	ADD TARGET package0.event_file
		(SET filename=N'Recompiles'
			, max_file_size=(10)
)
WITH 
	(MAX_MEMORY=4096 KB
		, EVENT_RETENTION_MODE=ALLOW_MULTIPLE_EVENT_LOSS
		, MAX_DISPATCH_LATENCY=30 SECONDS
		, MAX_EVENT_SIZE=0 KB
		, MEMORY_PARTITION_MODE=NONE
		, TRACK_CAUSALITY=OFF
		, STARTUP_STATE=OFF)
GO

ALTER EVENT SESSION Recompiles
ON SERVER
STATE = START;

Querying the Recompiles XEvent Session

Then I’ll use this query to look at my session.  It’s a little awkward in two ways.

First, I only leave the session running for a day, but this script needs it to be running to read from it.  The only reason for that is it pulls the file path from the running sessions.  You can get around this by putting the path into the script manually.  As for me, I usually query it and figure out my next steps while it’s running, then I stop the session.

Second, and this is quite humorous to me, it recompiles due to my temp tables every time it runs.  It’s a great example of what to ignore because it’s a low-cost recompile that happens on a seldom-used ad-hoc query where performance is not a major priority.  However, because temp table definitions are cached for proc plans, this goes away if you turn this script into a proc.  I laugh every time…

When you get the results in the #Queries temp table in the end they’re what you’re used to with it just being a table and all the XML out of the way.  The query at the end of the script views them all, but I’ll play around with it doing aggregations and more.  I encourage you to do the same.  This is also why it drops the table if it exists in the beginning instead of dropping them at the end.

DECLARE 
	@SessionName SysName 
	, @TopCount Int = 1000
	
SELECT @SessionName = 'Recompile'

--SELECT @SessionName = 'system_health'
/* 
SELECT * FROM sys.traces

SELECT  Session_Name = s.name, s.blocked_event_fire_time, s.dropped_buffer_count, s.dropped_event_count, s.pending_buffers
FROM sys.dm_xe_session_targets t
	INNER JOIN sys.dm_xe_sessions s ON s.address = t.event_session_address
WHERE target_name = 'event_file'
--*/

IF OBJECT_ID('tempdb..#Events') IS NOT NULL BEGIN
	DROP TABLE #Events
END

IF OBJECT_ID('tempdb..#Queries') IS NOT NULL BEGIN
	DROP TABLE #Queries 
END

DECLARE @Target_File NVarChar(1000)
	, @Target_Dir NVarChar(1000)
	, @Target_File_WildCard NVarChar(1000)

SELECT @Target_File = CAST(t.target_data as XML).value('EventFileTarget[1]/File[1]/@name', 'NVARCHAR(256)')
FROM sys.dm_xe_session_targets t
	INNER JOIN sys.dm_xe_sessions s ON s.address = t.event_session_address
WHERE s.name = @SessionName
	AND t.target_name = 'event_file'

SELECT @Target_Dir = LEFT(@Target_File, Len(@Target_File) - CHARINDEX('\', REVERSE(@Target_File))) 

SELECT @Target_File_WildCard = @Target_Dir + '\'  + @SessionName + '_*.xel'

--SELECT @Target_File_WildCard
CREATE TABLE #Events 
(
	event_data_XML XML
)

INSERT INTO #Events 
SELECT TOP (@TopCount) CAST(event_data AS XML) AS event_data_XML
FROM sys.fn_xe_file_target_read_file(@Target_File_WildCard, null, null, null) AS F
ORDER BY File_name DESC
	, file_offset DESC 

SELECT  EventType = event_data_XML.value('(event/@name)[1]', 'varchar(50)')
	, ObjectName = event_data_XML.value ('(/event/data  [@name=''object_name'']/value)[1]', 'sysname')
	, ObjectType = event_data_XML.value ('(/event/data  [@name=''object_type'']/text)[1]', 'sysname')
	, UserName = event_data_XML.value ('(/event/action  [@name=''username'']/value)[1]', 'sysname')
	, Statement_Text = ISNULL(ISNULL(event_data_XML.value ('(/event/data  [@name=''statement'']/value)[1]', 'NVARCHAR(4000)'), event_data_XML.value ('(/event/data  [@name=''batch_text''     ]/value)[1]', 'NVARCHAR(4000)')), event_data_XML.value ('(/event/data[@name=''wait_type'']/text)[1]', 'NVARCHAR(60)'))
	, Recompile_Cause = event_data_XML.value ('(/event/data  [@name=''recompile_cause'']/text)[1]', 'sysname')
	, TimeStamp = DateAdd(Hour, DateDiff(Hour, GetUTCDate(), GetDate()) , CAST(event_data_XML.value('(event/@timestamp)[1]', 'varchar(50)') as DateTime2))
	, SPID = event_data_XML.value ('(/event/action  [@name=''session_id'']/value)[1]', 'BIGINT')
	, Database_Name = DB_Name(event_data_XML.value ('(/event/action  [@name=''database_id'']/value)[1]', 'BIGINT'))
	, EventDetails = event_data_XML 
INTO #Queries
FROM #Events

SELECT q.EventType
	, q.ObjectType
	, q.ObjectName
	, q.Statement_Text
	, q.Recompile_Cause
	, q.TimeStamp
	, q.SPID
	, q.UserName
	, q.Database_Name
	, q.EventDetails
FROM #Queries q
ORDER BY TimeStamp DESC 

Hope It Helps

Let me know how this helps.  If anything can be done to make my approach or my scripts better, I’m always open to improvement.


TempDB Excessive Memory Usage Example

I see TempDB using more memory than I feel it should and found a way to resolve it.  Previously I dove into technical details and questioning what I saw in my post TempDB Memory Leak? which is great for proving and debugging an issue.  Now I want to step back and talk about it from a practical perspective.

To keep it practical, I’m going to walk through a single server, step-by-step.  What I saw that caught my eye and how I applied my workaround.  This is a real, production server with screen shots from Idera Diagnostic Manager for both before and after comparisons.

What I’m Seeing

A large portion of my buffer pool is being utilized by TempDB pages which are unallocated on disk.  The easiest way to see this is this quick query:

SELECT Unallocated_MB = COUNT(1)/128
FROM sys.dm_os_buffer_descriptors bd
	LEFT JOIN sys.allocation_units au ON bd.allocation_unit_id = au.allocation_unit_id
WHERE bd.database_id = 2
	AND au.allocation_unit_id IS NULL

The details of everything in memory can be seen on my post Query the Buffer Pool.

Since these are all pointing to real, but unallocated TempDB pages on disk, I was able to develop a workaround of simply having fewer TempDB pages on disk.  AKA, I made TempDB data files smaller.

Sizing TempDB

Here we’re talking about being hurt by TempDB being too large, but we can’t lose sight of TempDB being too small hurting you as well.  Specifically, when your server is the busiest with a small TempDB it will have to stop and grow the files, then deal with any fragmentation that process caused.  So, while I’m not going to recommend filling your dedicated drive, I’m not going to recommend making TempDB tiny, either.

My recommendation is to monitor your server, find out how much space TempDB uses, and make your TempDB significantly larger than that.  The longer you have watched your server, the better.  The goal is still to avoid almost any growth possible, but I’m adding in a “don’t go crazy” clause.

You can do this yourself as I talked about in Monitoring Database and Table Sizes using the function call FileProperty(<filename>, ‘space used’).  If you do it this way, make sure you have this running for a minimum of several weeks at least once an hour, day and night.  It’s possible, not difficult to do, and not recommended for servers that have a reasonable monitoring system already in place.

If you’re doing this to your production servers you should already have monitoring software that’s watching file sizes for you, even if it’s only tracking this in the background with no obvious way to find the information in the GUI.  This is the situation I find myself in using Idera Diagnostic Manager.  The data’s there, but the GUI is set up for more immediate concerns.  I need this query to get what I want out of it.

SELECT TOP 100 S.InstanceName
	, DS.UTCCollectionDateTime
	, D.DatabaseName 
	, DataUsed_GB = CAST((DataSizeInKilobytes + IndexSizeInKilobytes) / 1024 / 1024.0 AS DEC(20,1)) 
	, LogUsed_GB = CAST(LogSizeInKilobytes / 1024 / 1024.0 AS DEC(20,1))
FROM SQLdmRepository.dbo.DatabaseSize DS
	INNER JOIN SQLdmRepository.dbo.SQLServerDatabaseNames D ON DS.DatabaseID = D.DatabaseID
	INNER JOIN SQLdmRepository.dbo.MonitoredSQLServers S ON S.SQLServerID = D.SQLServerID 
WHERE UPPER(S.InstanceName) = 'SERVER\INSTANCE'  
	AND D.DatabaseName = 'tempdb'
	AND UTCCollectionDateTime > GetUTCDate()-180
ORDER BY 4 DESC

My recommendation is to take the peak size outside of a one-time process and make the total TempDB data files at least 150% of that size.  If you have 4 TempDB data files and the peak size used is 4 GB, 150% of that is 6 GB, so make each file at least 1.5 GB.  Then set autogrowth to something reasonable because one-time processes will happen.

My Before Observations

All of the screen shots and trending information are from Idera Diagnostic Manger, but you should be able to get the same basic information out of any monitoring software.

I had a server with rather low PLE and a lot of physical I/O.

Server_Oversized_TempDB

The physical I/O is difficult to see here because this server has a lot of writes.  When you look closer you can see that it rather regularly went to 400 page reads per second.

PhysicalIO_Oversize_TempDB

All of those reads caused lots of waits on the server.  In my 12-hour sample period I saw a total of 34,000.  The units shown for this field are fine for comparison reasons, but they appear to be a total of the ms/s on the chart for values collected every 6 minutes, not the total waits.  You have to query the tables behind Idera Diagnostic Manager to get the real values.  In this case, the total waits were 138 minutes for shared and 49 for exclusive latches, for a total of 187 minutes of waiting for the 12 hours.

Waits_Oversize_TempDB

Just seeing this I wanted to request more memory on the VM, after all it only had 16 GB.  However, I made it a rule to never add memory without justifying what’s in memory first.  To do that, I used my query on Query the Buffer Pool, and this was the first line in the results:

Cache_Oversized_TempDB

Of the 8.5 GB of memory used by the buffer pool, about 6 GB of that was used by unallocated space in TempDB.  I can accept some because of how TempDB caches temp tables and other stuff, but to have 70% of the buffer pool used up while I’m seeing low PLE and high I/O is not acceptable.

My Fix

I had the files set to practically fill the dedicated drive according to best practices, so each of the 4 files was 7,000 MB adding up to almost 28 GB on a 30 GB drive.

Using the query in the Sizing TempDB section above, this server has never used more than 1 GB of data in TempDB at one time.  While that makes for some interesting questions on how it’s using 6 GB of cache, it does give me a lot of room to reduce the size.

There were no complaints about performance due to what this server is being used for, so I didn’t try to shrink TempDB.  Instead I took the patient approach an resized TempDB, which took effect the next time SQL Services restarted.  Then I waited for our scheduled server reboots for Windows Updates.

ALTER DATABASE [tempdb] MODIFY FILE ( NAME = N'tempdev',SIZE = 512MB , FILEGROWTH = 128MB )
ALTER DATABASE [tempdb] MODIFY FILE ( NAME = N'tempdev2',SIZE = 512MB , FILEGROWTH = 128MB )
ALTER DATABASE [tempdb] MODIFY FILE ( NAME = N'tempdev3',SIZE = 512MB , FILEGROWTH = 128MB )
ALTER DATABASE [tempdb] MODIFY FILE ( NAME = N'tempdev4',SIZE = 512MB , FILEGROWTH = 128MB )

Note that my recommendation above would have been to make the files at least 1.5 GB and I made them 2 GB here.  I’m not worried about exact numbers, I’m worried about being reasonable sizes that also avoid growths.  With peak observed usage at 1 GB and TempDB sized at 2 GB, any growths should be very rare.

Overall, the data files will grow at 512 MB at a time, which, when it happens, is large enough to avoid extreme fragmentation yet small enough to avoid extreme waits.  This should only happen during “I didn’t mean to do that” or “how’d it get that execution plan” moments, but it will happen.

My After Observations

After the change I waited a couple days to let the cache stabilize after a reboot.  We rebooted on Saturday, and all of these numbers are from the Tuesday after.

When I looked again, TempDB was using 1/10 of the space it was before for unallocated pages in memory.  It’s not perfect, but it’s much better.

Cache_RightSize_TempDB

TempDB using less cache allowed PLE be a lot more stable, regularly staying well above 2,000.  Using Jonathan Kehayias’s formula, PLE should be above 1,050 on a server with 14 GB of cache, so this is looking good.

Server_RightSize_TempDB

With data staying in cache more, physical I/O also dropped.  Before it was normal to see spikes to 400 page reads per second, now you’re seeing about half of that.

PhysicalIO_RightSize_TempDB

Less activity also meant less waits.  The couple spikes still went almost as high, but those are things you’ll fix more through tuning than memory management.  The totals at the bottom are what I’m focused on right now, the PageIOLatch_xx waits combined added up to about 11,000 for the day, so about 1/3 of what it was before.

Again, I don’t like how Idera Diagnostic Manager calculates the totals.  When I queried the tables I saw that there was 60 minutes of waits on shared latches and 13 minutes on exclusive latches, for a total of 73 minutes.  This is in comparison to 138 + 49 = 187 minutes before.

Waits_Rightsize_TempDB

The Downside

Even with the new, smaller size, TempDB is a lot larger than it needs to be so it would be very rare to see any growths in the near future.  However, I have to keep in mind that the load on my servers will always be increasing, so I may end up hitting autogrowth down the road.  Then I’ll reboot the servers each month with Windows Updates, it’ll shrink TempDB back down for me, and it will have to grow again the next month.

Because of this, I’ll need to visit every one of my servers from time to time (semi-annually?) to see if this is occurring and increase the size of TempDB if it is.  I’ll use the same script for determining the peak sizes because I have software that’s capturing that already, but I could find other methods to get that information if I needed to.

The only other downside I see is with servers that hit a high peak TempDB usage overnight then never come close to it again during the day.  This workaround won’t do much for those servers.  You need that space overnight, so trying to make the size smaller than what it needs at 2 AM will just make everything worse.  However, knowing about this will drive you nuts enough to look into the overnight processes to see if  you can lower peak usage.  Perhaps you can spread out some concurrent tasks or tune some bad queries that never mattered due to their timing.  It’s not a bad thing to do this work, it’s just that this probably wasn’t a good time for something to climb up your priority list.

Take a Look

Take a look at your servers.  How much cache is TempDB using?  Does TempDB ever even use half of the space allocated to it?  Is it causing issues on your servers?

Never make a change just because you saw someone say it’s a good idea, especially if they’ve never seen your servers before.  Look at the numbers on your servers for yourself, ask questions to understand it, and make the best decision for those specific servers.

If you do make this change, check TempDB before your next reboot.  Did it have to grow?  If it did, you need to change the size manually so it doesn’t have to hit an autogrowth every month.  If you shrunk it down to 2 GB total then it grew to 2.5 GB, consider making it 3.5 GB to avoid future growths while keeping the files reasonably sized.

If this was an issue on your servers and you feel SQL Server shouldn’t have functioned this way, please visit the Connect Item on this.  An up-vote is great, a comment or anything else is even better.


Querying Deadlocks From System_Health XEvent

It’s easy to query XEvents to see some of the basic info in deadlocks, including the system_health session which is already capturing this information by default.

This script will, by default, read from system_health.  However, change the name of one parameter at the start to have it read from any active session.  I pull the file name automatically, so the session has to be active to avoid many changes to the script.

The Script

DECLARE @SessionName SysName 

SELECT @SessionName = 'system_health'

/* 
SELECT  Session_Name = s.name, s.blocked_event_fire_time, s.dropped_buffer_count, s.dropped_event_count, s.pending_buffers
FROM sys.dm_xe_session_targets t
	INNER JOIN sys.dm_xe_sessions s ON s.address = t.event_session_address
WHERE target_name = 'event_file'
--*/

IF OBJECT_ID('tempdb..#Events') IS NOT NULL BEGIN
	DROP TABLE #Events
END

DECLARE @Target_File NVarChar(1000)
	, @Target_Dir NVarChar(1000)
	, @Target_File_WildCard NVarChar(1000)

SELECT @Target_File = CAST(t.target_data as XML).value('EventFileTarget[1]/File[1]/@name', 'NVARCHAR(256)')
FROM sys.dm_xe_session_targets t
	INNER JOIN sys.dm_xe_sessions s ON s.address = t.event_session_address
WHERE s.name = @SessionName
	AND t.target_name = 'event_file'

SELECT @Target_Dir = LEFT(@Target_File, Len(@Target_File) - CHARINDEX('\', REVERSE(@Target_File))) 

SELECT @Target_File_WildCard = @Target_Dir + '\'  + @SessionName + '_*.xel'

--Keep this as a separate table because it's called twice in the next query.  You don't want this running twice.
SELECT DeadlockGraph = CAST(event_data AS XML)
	, DeadlockID = Row_Number() OVER(ORDER BY file_name, file_offset)
INTO #Events
FROM sys.fn_xe_file_target_read_file(@Target_File_WildCard, null, null, null) AS F
WHERE event_data like '<event name="xml_deadlock_report%'

;WITH Victims AS
(
	SELECT VictimID = Deadlock.Victims.value('@id', 'varchar(50)')
		, e.DeadlockID 
	FROM #Events e
		CROSS APPLY e.DeadlockGraph.nodes('/event/data/value/deadlock/victim-list/victimProcess') as Deadlock(Victims)
)
, DeadlockObjects AS
(
	SELECT DISTINCT e.DeadlockID
		, ObjectName = Deadlock.Resources.value('@objectname', 'nvarchar(256)')
	FROM #Events e
		CROSS APPLY e.DeadlockGraph.nodes('/event/data/value/deadlock/resource-list/*') as Deadlock(Resources)
)
SELECT *
FROM
(
	SELECT e.DeadlockID
		, TransactionTime = Deadlock.Process.value('@lasttranstarted', 'datetime')
		, DeadlockGraph
		, DeadlockObjects = substring((SELECT (', ' + o.ObjectName)
							FROM DeadlockObjects o
							WHERE o.DeadlockID = e.DeadlockID
							ORDER BY o.ObjectName
							FOR XML PATH ('')
							), 3, 4000)
		, Victim = CASE WHEN v.VictimID IS NOT NULL 
							THEN 1 
						ELSE 0 
						END
		, SPID = Deadlock.Process.value('@spid', 'int')
		, ProcedureName = Deadlock.Process.value('executionStack[1]/frame[1]/@procname[1]', 'varchar(200)')
		, LockMode = Deadlock.Process.value('@lockMode', 'char(1)')
		, Code = Deadlock.Process.value('executionStack[1]/frame[1]', 'varchar(1000)')
		, ClientApp = CASE LEFT(Deadlock.Process.value('@clientapp', 'varchar(100)'), 29)
						WHEN 'SQLAgent - TSQL JobStep (Job '
							THEN 'SQLAgent Job: ' + (SELECT name FROM msdb..sysjobs sj WHERE substring(Deadlock.Process.value('@clientapp', 'varchar(100)'),32,32)=(substring(sys.fn_varbintohexstr(sj.job_id),3,100))) + ' - ' + SUBSTRING(Deadlock.Process.value('@clientapp', 'varchar(100)'), 67, len(Deadlock.Process.value('@clientapp', 'varchar(100)'))-67)
						ELSE Deadlock.Process.value('@clientapp', 'varchar(100)')
						END 
		, HostName = Deadlock.Process.value('@hostname', 'varchar(20)')
		, LoginName = Deadlock.Process.value('@loginname', 'varchar(20)')
		, InputBuffer = Deadlock.Process.value('inputbuf[1]', 'varchar(1000)')
	FROM #Events e
		CROSS APPLY e.DeadlockGraph.nodes('/event/data/value/deadlock/process-list/process') as Deadlock(Process)
		LEFT JOIN Victims v ON v.DeadlockID = e.DeadlockID AND v.VictimID = Deadlock.Process.value('@id', 'varchar(50)')
) X --In a subquery to make filtering easier (use column names, not XML parsing), no other reason
ORDER BY DeadlockID DESC

System_health session

The system_health XEvent by default is turned on, captures deadlocks, and is limited to four 5MB files.  You can change all three of those, but it’s not common for people to do that.

Yes, you’re limited to more recent events, but the information is there.  If you find the limitations are too much, you have a couple options that should be considered in this order.

  1. Is anything else capturing deadlocks?  For me, I have Idera Diagnostic Manager capturing deadlocks as well for my production servers.  This is my main source of looking at deadlocks, so I actually rarely use system_health for this purpose in production.  The first goal is to avoid doing anything additional.
  2. Consider setting system_health to use bigger files (not too big) or have more rollover files. The more you do the more resources it will take to read it all at once, so don’t go crazy.  However, if you have 5 days of data when you wish you had 7, it’s not horrible to double the size of data you retain.  The second goal is to increase disk usage before you add more overhead.
  3. Consider a separate XEvent session.  Ugh…I wish I didn’t have to throw this out there as an option.  Love your servers, don’t add more overhead if you don’t have to.  The last resort is to not end up here at your last resort.

Idera Diagnostic Manager

At the time of me writing this, I have a script to look at all of the deadlocks in Idera DM that I use quite regularly for my production servers.  However, they just came out with a new major version and I want to make sure my query runs there before posting my script publically.  If you don’t care and just want the script, email me.

Viewing the Deadlock

The details of this script give you a great overview of the deadlock.  You know the code involved on each side, the tables and applications involved, etc.   It’s enough to look for trends, know if a deadlock was one you expected, and other basics.

However, this is just a summary list of your recent deadlocks, it’s not the details.  For me, I’m very happy just looking at the XML output to see the details.  This is how I look at it from XEvents and my monitoring software.  That makes me odd, and I’m ok with that.

Jonathan Kehayias (b|t) talks about viewing them in SQL Sentry Plan Explorer Pro in his post Graphically Viewing Extended Events Deadlock Graphs.  There’s no single right answer on how to view deadlocks, so do what works best for you.

Troubleshooting Deadlocks

This topic goes well beyond what I’m going for in this post.  Jonathan Kehayias gets into it some in his post The Accidental DBA (Day 29 of 30): Troubleshooting Deadlocks, which is just a start.  The book he co-authored with Ted Krueger (b|t), Troubleshooting SQL Server – A Guide for the Accidental DBA, is available as a free PDF and has an entire chapter on this subject.


TempDB memory leak?

I found a bug where I’m seeing TempDB use more memory than it should on multiple versions of SQL Server, especially on servers set up with common best practices. There’s a workaround that has a profound affect on server performance, adding to my belief that this is a legitimate bug and leading me to open a Connect Item on the issue.

Querying the Buffer Pool

I have a query to show me what’s in the buffer pool for the entire server, showing the expected results as well as excessive space being used by TempDB.  The newest version showing these details is on my post Querying the Buffer Pool.

It shows number of pages in the buffer pool grouped by the database, table, and index.  The query makes use of left joins so it can see space in memory that’s not currently allocated to a specific object.

The results are surprising in many ways.

The good surprises are seeing what indexes are hogging up your buffer pool so you have an idea of where to start tuning.  I’m a huge fan of this and have blogged about it in Cleaning Up the Buffer Pool to Increase PLE, although the name of my older post is misleading because it does more than just help memory management in SQL Server.

The Bug

The bad surprise was a bug which has been harassing me for quite some time now.  As I mentioned, the query will return all the space in the buffer pool, specifically the contents of sys.dm_os_buffer_descriptors, and does a left join to the tables leading up to and including sys.indexes so space not currently allocated to a table will show up.  The problem is that the space that shows up as unallocated for TempDB is much larger than expected, in this case taking up 1/3 of my buffer pool.

QueryBufferPool_TempDB

On this post I’m talking about a single server, but the problem wasn’t limited to a single server.  It showed up at the same time, caused by the same change (implementing a common best practice), partially resolved by the same partial rollback (undoing the best practice) on SQL 2008 R2, SQL 2012, and SQL 2014.

Details About the Bug

So the query I have on yesterday’s post, Querying the Buffer Pool, showed I had unallocated space in TempDB in memory, and a lot of it.  However, it doesn’t show details.

To start looking at the details, what kind of pages are these that exist in sys.dm_os_buffer_descriptors, but not in sys.allocation_units?

SELECT bd.page_type
	, MB = count(1) / 128
FROM sys.dm_os_buffer_descriptors bd
	LEFT JOIN sys.allocation_units au ON bd.allocation_unit_id = au.allocation_unit_id
WHERE bd.database_id = 2 --TempDB
	AND bd.is_modified = 0 --Let's not play dirty, only clean pages
	AND au.allocation_unit_id IS NULL --It's not even allocated
GROUP BY bd.page_type 
ORDER BY 2 DESC

TempDB_BufferPool_Unallocated

Ok, so we’re dealing with typical data in TempDB.  Well, other than it not being allocated, of course.

So I run another query to get more details.  This time I want to look inside the pages to see if they tell a different story.

SELECT TOP 100 bd.*
FROM sys.dm_os_buffer_descriptors bd
	LEFT JOIN sys.allocation_units au ON bd.allocation_unit_id = au.allocation_unit_id
WHERE bd.database_id = 2 --TempDB
	AND bd.is_modified = 0 --Let's not play dirty, only clean pages
	AND au.allocation_unit_id IS NULL --It's not even allocated

TempDB_PageLevel_Unallocated

Then I follow that up with Paul Randal’s How to use DBCC PAGE, which comes with all the disclaimers about using an undocumented and unsupported trace flag and command.  This one isn’t horrible in my mind or Paul’s comments, but remember the undocumented and unsupported parts.

DBCC TRACEON (3604);

DBCC PAGE (2, 5, 502219	, 0)
DBCC PAGE (2, 5, 374929	, 0)
DBCC PAGE (2, 5, 69868	, 0)
DBCC PAGE (2, 5, 453687	, 0)
DBCC PAGE (2, 5, 214988	, 0)
DBCC PAGE (2, 5, 440966	, 0)

DBCC TRACEOFF (3604);

The results all looked about the same to me.

DBCC_Page_Results

There are several important parts to me.  The m_objId is a negative value I can’t find in TempDB.sys.objects, so it WAS a temporary object that no longer exists.  Across the board, these are “NOT ALLOCATED”, “NOT CHANGED”, “NOT MIN_LOGGED”, “0_PCT_FULL”, so there’s nothing there.

To me it looks like temp objects made it into memory and remained in memory after the temporary objects were dropped.  I have no idea what objects these were or how they were dropped, but I’m imagining these were temp tables automatically dropped when the session was either closed or reset.

A Recent Change (A CLUE)

I found this by noticing that PLE for several servers was lower now than it has been in the past, so I was peeking in the buffer pool to see who was playing nice.  Going off of “when did PLE start to be lower” I noticed that I implemented a change around that time to use a common best practice.

That change was presizing TempDB data files to take up a vast majority of the dedicated LUN instead of letting them grow as needed.  It avoids waiting for file growth, especially if you’re using TDE (I’m not) and can’t use IFI (I can), but for several other reasons as well, including file fragmentation and the slight pause even IFI causes.  So at the start of all these festivities, I took the 4 TempDB data files from 100 MB each to 12 GB each, using up 48 GB of the 50 GB available.

A Workaround

Seeing this, I wanted to partially roll back the change the next opportunity I had.  100 MB was too small and I was aware that it invoked file growths every month (we reboot monthly for OS updates).  48 GB wasn’t right though, we just have that much space on the drive due to server build standards and paranoia (I’m a DBA).  So I went through our Idera Diagnostic Manager monitoring software and found the most space TempDB used, which is captured once an hour.  I found that 4.8 GB was the peak usage with several incidents of usage going over 4.5 GB.

With that information available and still not wanting an autogrowth for all the reasons listed above, I decided that all 4 files should be 1.5 GB, so 6 GB total.  That means peak usage was about 75% full, leaving plenty of room for error, especially with my baseline only being captured once an hour.  Autogrowth is set to 256 MB, so it’d add 1 GB total each growth.  I can live with that.

I can’t say it eliminated the issue because I still have 2 GB of unallocated TempDB space in cache, but it’s better than 8 GB.  It can be considered more acceptable than other issues I need to tackle right now, but it still bugs me.

What’s the Best Practice?

It’s a best practice to have TempDB data files on their own LUN, drive, array, however you want to word it.  Then it just make sense to have the total size of your data files add up to 90% or more of the drive size.  I see this advice everywhere, with these two standing out:

  • Solar Winds – Configuration Best Practices for SQL Server Tempdb–Initial Sizing
    • “Next, if you can give tempdb its own disk, then configure it to almost fill the drive. If nothing else will ever be on the drive, then you’re better off setting it to be larger than you’ll ever need. There’s no performance penalty, and you’ll never have to worry about autogrow again.”
  • Brent Ozar – SQL Server 2005/2008/2012/2014 Setup Checklist
    • “Notice that I don’t have filegrowth enabled.  You want to proactively create the TempDB files at their full sizes to avoid drive fragmentation.”

Jonathan Kehayias does it a little bit differently in his post SQL Server Installation Checklist saying to add space to TempDB files in 4 GB increments.  Although he doesn’t fill the drive by default, this isn’t mentioned by him, either.

Now I need to be perfectly clear on this, I trust these three sources.  I trust Jonathan and Brent more than I trust myself with setting up SQL Server.  I also feel the same about the authors I know on the Solar Winds post.  This does not change that.

Sizing TempDB like that often means it’s much larger than you need.  The workaround I’m using is to right-size these files instead.  For me, for now, I’m going to stick with seeing how large TempDB gets and make it slightly larger than that until I have a solid answer to my problem.

What Was It?

I still don’t know.  The workaround managed to knock it off of my priority list enough where I’m not actively working on it.  However, my drive to understand SQL Server better won’t leave me alone.

This post is my solution.  I have some very intelligent people reading this who I hope will at least lead me further down the rabbit hole, even if they don’t have a conclusive answer.  There’s a good chance I’ll be asking for help on Twitter with #sqlhelp or opening a connect item on this, for which I have a very well documented description of the issue that I can link to.

Updates:

2016-01-06 – Caching of Temporary Objects

Due to a comment, I started looking into the caching of temporary objects to see if this was the root cause.  The comment specifically mentioned Paul White’s (b|t) post Temporary Object Caching Explained, and I also read over Itzik Ben-Gan’s (b|t) post Caching Temporary Objects.

Both of these left me with the impression that smaller amounts of data would be left in the cache linked to temporary objects linked to the proc cache.  What I’m seeing is large amounts of data in the buffer pool that did not drop when I ran DBCC FREEPROCCACHE (on a test server that wasn’t in active use) as I expected if this was the full explanation.

While it’s very likely this is related to the issue on hand, I’m not ready to accept it as a full explanation.  If the memory associated with TempDB dropped when clearing the proc cache (on a test server) then it would have been a great explanation with a poor side effect of going too far with the memory being used.

2016-01-07 – Opened a Connect Item

I mentioned this issue on the comments of Paul White’s blog post mentioned in the last update and comments below on this post.  His response concluded with this:

So, when memory pressure is detected, I would expect memory use like this to be freed up for reuse in pretty short order, by design. If it is not, and bad things happen because memory for unallocated tempdb is not released/reused, that would be a bug.

While I was already leaning that way, it pushed me over the edge to decided it was time to open up a connect item on this issue.  I feel it’s well worth the read going to Paul’s post and the connect item.  Also, if you’re seeing this as well, an upvote on connect is very appreciated.

https://connect.microsoft.com/SQLServer/feedback/details/2215297

Query the Buffer Pool

DBAs are known for asking for more memory, but often can’t say what’s in memory.  While I agree that many database servers can use more memory, I’m a firm believer in knowing how you’re using your resources before asking for more.  The script below allows me to do just that.

What It Returns

This will return every index that is using at least 1 MB of memory for every database on your server.  It also returns space in memory that is associated with unallocated space in the tables which shows up as NULL for everything except the size of the space and the table name.

I’ll warn you now that the unallocated space can be surprisingly high for TempDB, and I talk about that in TempDB Memory Leak?.  Hopefully we can get a good comment thread going on that post to talk through what we’re seeing and how common the issue really is.

The Script

IF OBJECT_ID('TempDB..#BufferSummary') IS NOT NULL BEGIN
	DROP TABLE #BufferSummary
END

IF OBJECT_ID('TempDB..#BufferPool') IS NOT NULL BEGIN
	DROP TABLE #BufferPool
END

CREATE TABLE #BufferPool
(
	Cached_MB Int
	, Database_Name SysName
	, Schema_Name SysName NULL
	, Object_Name SysName NULL
	, Index_ID Int NULL
	, Index_Name SysName NULL
	, Used_MB Int NULL
	, Used_InRow_MB Int NULL
	, Row_Count BigInt NULL
)

SELECT Pages = COUNT(1)
	, allocation_unit_id
	, database_id
INTO #BufferSummary
FROM sys.dm_os_buffer_descriptors 
GROUP BY allocation_unit_id, database_id 
	
DECLARE @DateAdded SmallDateTime  
SELECT @DateAdded = GETDATE()  
  
DECLARE @SQL NVarChar(4000)  
SELECT @SQL = ' USE [?]  
INSERT INTO #BufferPool (
	Cached_MB 
	, Database_Name 
	, Schema_Name 
	, Object_Name 
	, Index_ID 
	, Index_Name 
	, Used_MB 
	, Used_InRow_MB 
	, Row_Count 
	)  
SELECT sum(bd.Pages)/128 
	, DB_Name(bd.database_id)
	, Schema_Name(o.schema_id)
	, o.name
	, p.index_id 
	, ix.Name
	, i.Used_MB
	, i.Used_InRow_MB
	, i.Row_Count     
FROM #BufferSummary AS bd 
	LEFT JOIN sys.allocation_units au ON bd.allocation_unit_id = au.allocation_unit_id
	LEFT JOIN sys.partitions p ON (au.container_id = p.hobt_id AND au.type in (1,3)) OR (au.container_id = p.partition_id and au.type = 2)
	LEFT JOIN (
		SELECT PS.object_id
			, PS.index_id 
			, Used_MB = SUM(PS.used_page_count) / 128 
			, Used_InRow_MB = SUM(PS.in_row_used_page_count) / 128
			, Used_LOB_MB = SUM(PS.lob_used_page_count) / 128
			, Reserved_MB = SUM(PS.reserved_page_count) / 128
			, Row_Count = SUM(row_count)
		FROM sys.dm_db_partition_stats PS
		GROUP BY PS.object_id
			, PS.index_id
	) i ON p.object_id = i.object_id AND p.index_id = i.index_id
	LEFT JOIN sys.indexes ix ON i.object_id = ix.object_id AND i.index_id = ix.index_id
	LEFT JOIN sys.objects o ON p.object_id = o.object_id
WHERE database_id = db_id()  
GROUP BY bd.database_id   
	, o.schema_id
	, o.name
	, p.index_id
	, ix.Name
	, i.Used_MB
	, i.Used_InRow_MB
	, i.Row_Count     
HAVING SUM(bd.pages) > 128  
ORDER BY 1 DESC;'  

EXEC sp_MSforeachdb @SQL

SELECT Cached_MB 
	, Pct_of_Cache = CAST(Cached_MB * 100.0 / SUM(Cached_MB) OVER () as Dec(20,3))
	, Pct_Index_in_Cache = CAST(Cached_MB * 100.0 / CASE Used_MB WHEN 0 THEN 0.001 ELSE Used_MB END as DEC(20,3))
	, Database_Name 
	, Schema_Name 
	, Object_Name 
	, Index_ID 
	, Index_Name 
	, Used_MB 
	, Used_InRow_MB 
	, Row_Count 
FROM #BufferPool 
ORDER BY Cached_MB DESC

Where’d the Script Come From

I’ve had a script similar to this one around for a while.  It’s originally based off of Jonathan Kehayias’s script on his post Finding What Queries in the Plan Cache Use a Specific Index, and I couldn’t have done this without having his script to start with.

Then I originally posted a version of this script on my post Cleaning Up the Buffer Pool to Increase PLE, which was great to see the index usage for a single database.  It runs slower than this, only returns a single database, and does not show unallocated space in memory.  Those changes warranted either an update to that post or a completely new post…I opted for the latter.

What It Means

Now you can see what’s in your memory. Hopefully you’ll see one or two things that stand out on here that don’t make sense; those are your easy tuning opportunities.

If an index is 100% in cache then you’re scanning on it, and that may be an issue.  Yes, you can find when you did scans on indexes using the scripts in my Indexes – Unused and Duplicates post, but it helps to have another view of what that means in your memory.

One thing the index monitoring scripts in the post I just mentioned can’t do is tell you when you’re doing large seeks as opposed to small seeks.  With the typical phone book example, you could ask for all the names in the phone book where the last names begins with anything from A to Y, giving you 98% of the phone book as results.  Index usage stats will show you did a seek, which sounds efficient.  The script on this post will show that you have 98% of your index in cache immediately after running the query, and that gives you the opportunity to find the issue.

When you see an index that looks out of place here, dive back into the scripts on Cleaning Up the Buffer Pool to Increase PLE to see what’s in cache using that index.  If the query isn’t in cache for any reason, you may be able to look at the last time the index had a scan or seek against it in sys.dm_db_index_usage_stats and compare that to results from an Extended Events session you had running to see what it could have been.

The main point is that you have something to get you started.  You have specific indexes that are in memory, and you can hunt down when and why those indexes are being used that way.  It’s not always going to be easy, but you have a start.

We’re All On a Budget

It’s not too uncommon for this process to end in asking for more memory, and I view memory like being on a budget.  The amount of memory you have right now is your current budget.  Asking for more memory should be viewed like asking for more money in a financial budget.  For a financial budget increase, here are the questions I’d be prepared to answer:

  1. What did you spend the money we already gave you on?
  2. Did you spend that money as efficiently as possible?
  3. What else do you want to spend money on?

Now you can answer these questions in database form:

  1. Here’s what I have in cache at multiple times, specifically right after PLE dropped.
  2. I went through the queries that pulled the data into cache and tuned what I could.
  3. When I checked what’s in cache multiple times, these indexes fluctuated a lot in how much was in there.  I believe adding more memory would allow them to stay in cache instead of kicking each other out to make room.

Be it Virtual or Physical environments, there’s only so much memory that can be made available to us.  We’re on budgets of how much memory the host has, how many memory slots a server has, and how large the memory chips are that those slots can handle.  Prove you’re doing it right and it’s a lot harder to say no to you.

I have an odd habit of getting the memory I ask for because I answer these questions up front in the initial request for memory.

Extended Events Intro

Extended Events is supposed to be taking over for most of Profiler and server-side tracing functionality, but there were people like me out there that took their time making the switch. For me the excuse was SQL Batch Completed isn’t in 2008 / 2008 R2, most databases are slow to move off of 2008 because it’s hard to say 2008 can’t do everything you want, and, well, I really like SQL Batch Completed!!!

Now I’m losing my excuses. It’s been three years since 2012 came out and all the new servers I’m installing are 2012 or 2014, so I lost that excuse. Then I came up with “I don’t know how to use them, but I know how to use something that does almost the same thing”; that’s great logic during an outage, but terrible logic for the long term. So, I’m learning it, still learning it, and I have something to help out those who made it to 2012 but are still stuck on the “I don’t know how to use them” phase of denial.

In several of my blog posts I referenced my favorite server-side trace. Capture everything on the server that takes over X seconds, with 5 being my favorite starting place. Yes, this adds about 1ms to anything that takes over 5 seconds, which adds up to…insignificant. Seriously, if this kills your server then it was dead already, but you will see arguments against creating this for long-term runs.  I don’t agree with those arguments, but they’re your servers and I want you to make an informed decision on what you run.

Anyways, here’s how I set it up with Extended Events, for which I used Jonathan Kehayias’s (b|t) Trace to XE Converter to get started.

IF EXISTS (SELECT 1 FROM sys.server_event_sessions WHERE name = 'DurationOver5Sec')
	DROP EVENT SESSION [DurationOver5Sec] ON SERVER;
GO
CREATE EVENT SESSION [DurationOver5Sec]
ON SERVER
ADD EVENT sqlserver.rpc_completed(
	ACTION 
	(
		  sqlserver.client_app_name	-- ApplicationName from SQLTrace
		, sqlserver.client_hostname	-- HostName from SQLTrace
		, sqlserver.client_pid	-- ClientProcessID from SQLTrace
		, sqlserver.database_id	-- DatabaseID from SQLTrace
		, sqlserver.request_id	-- RequestID from SQLTrace
		, sqlserver.server_principal_name	-- LoginName from SQLTrace
		, sqlserver.session_id	-- SPID from SQLTrace
	)
	WHERE 
	(
			duration >= 5000000
	)
),
ADD EVENT sqlserver.sql_batch_completed(
	ACTION 
	(
		  sqlserver.client_app_name	-- ApplicationName from SQLTrace
		, sqlserver.client_hostname	-- HostName from SQLTrace
		, sqlserver.client_pid	-- ClientProcessID from SQLTrace
		, sqlserver.database_id	-- DatabaseID from SQLTrace
		, sqlserver.request_id	-- RequestID from SQLTrace
		, sqlserver.server_principal_name	-- LoginName from SQLTrace
		, sqlserver.session_id	-- SPID from SQLTrace
	)
	WHERE 
	(
		duration >= 5000000
	)
),
ADD EVENT sqlos.wait_info(
	ACTION 
	(
		  sqlserver.client_app_name	-- ApplicationName from SQLTrace
		, sqlserver.client_hostname	-- HostName from SQLTrace
		, sqlserver.client_pid	-- ClientProcessID from SQLTrace
		, sqlserver.database_id	-- DatabaseID from SQLTrace
		, sqlserver.request_id	-- RequestID from SQLTrace
		, sqlserver.server_principal_name	-- LoginName from SQLTrace
		, sqlserver.session_id	-- SPID from SQLTrace
	)
	WHERE
	(
		duration > 5000 --This one is in milliseconds, and I'm not happy about that
            AND ((wait_type > 0 AND wait_type < 22) -- LCK_ waits
                    OR (wait_type > 31 AND wait_type < 38) -- LATCH_ waits
                    OR (wait_type > 47 AND wait_type < 54) -- PAGELATCH_ waits
                    OR (wait_type > 63 AND wait_type < 70) -- PAGEIOLATCH_ waits
                    OR (wait_type > 96 AND wait_type < 100) -- IO (Disk/Network) waits
                    OR (wait_type = 107) -- RESOURCE_SEMAPHORE waits
                    OR (wait_type = 113) -- SOS_WORKER waits
                    OR (wait_type = 120) -- SOS_SCHEDULER_YIELD waits
                    OR (wait_type = 178) -- WRITELOG waits
                    OR (wait_type > 174 AND wait_type < 177) -- FCB_REPLICA_ waits
                    OR (wait_type = 186) -- CMEMTHREAD waits
                    OR (wait_type = 187) -- CXPACKET waits
                    OR (wait_type = 207) -- TRACEWRITE waits
                    OR (wait_type = 269) -- RESOURCE_SEMAPHORE_MUTEX waits
                    OR (wait_type = 283) -- RESOURCE_SEMAPHORE_QUERY_COMPILE waits
                    OR (wait_type = 284) -- RESOURCE_SEMAPHORE_SMALL_QUERY waits
	--OR (wait_type = 195) -- WAITFOR
                )
	)
)
ADD TARGET package0.event_file
(
	SET filename = 'DurationOver5Sec.xel',
		max_file_size = 10,
		max_rollover_files = 5
)
WITH 
(
	MAX_MEMORY = 10MB
	, MAX_EVENT_SIZE = 10MB
	, STARTUP_STATE = ON
	, MAX_DISPATCH_LATENCY = 5 SECONDS
	, EVENT_RETENTION_MODE = ALLOW_MULTIPLE_EVENT_LOSS
);

ALTER EVENT SESSION DurationOver5Sec
ON SERVER
STATE = START;
	

What’s it all mean?

This captures all SQL Batch Completed and RPC Completed events that took over 5 seconds along with any waits that took over 5 seconds. Seems kind simple and much easier to read than the script to create a trace, but there are some things to point out here.

  • Duration – Milliseconds or Microseconds
  • File Location
  • Restart on server reboot

First, duration, is it milliseconds or microseconds? Trick question, it’s both!!! Ola Hallengren (b|t) opened This Connect Item which resulted in Microsoft apologizing and saying they’ll fix it in SQL 2016. They can “fix” it one of two ways. Either they’ll document them as being different scales and your script will still work without any modifications, or they’ll make them all be the same scale and the script I have here will behave differently on different versions of SQL Server. Anyways, the script I have here is 5 seconds all around, which is 5,000,000 microseconds for the SQL and 5,000 milliseconds for the waits.

Continuing on the duration confusion, the wait info’s duration still isn’t what you might think it is.  This is the duration for a single instance of a wait, not cumulative waits for the duration of a specific query or batch.  If you made a loop that executed 10 times calling a wait for delay of 1 second each time then those are 10 separate 1 second waits.  More important, if your query is doing physical reads from disk then it’s a ton of small PageIOLatch waits, not one large one this session will see.  I understand why it has to be this way, but understanding and enjoying are two different things.

The rest of this isn’t nearly as confusing, I promise.

The file location I’m using is just a filename without a path, which will default to where your error log files are. It’s going to be a much more complex name once SQL Server is done with it, and not just a underscore with a rollover count like server-side traces.  However, it will start how it’s written here and you can use wildcards to say which files you want to read.

Now when you restarted the server, or just SQL services, with server-side traces you’d have to manually start that trace again if you wanted it to run all the time. This is exactly how the script I have here works, too. However, Extended Events also added “Startup State” which means it will start when the server starts. The only issue I have with this is that it will ONLY automatically start when the services start. That’s all fine and good if you’re a patient person….it’s not all fine and good for me, so I manually start it when it’s created.

The other minor details I can see having questions on are on the Max Dispatch Latency and Event Retention Mode. These are limits on how it writes to the file location I’m using. Max Dispatch means that SQL Server will write it to the output file within that many seconds after the event actually happens, so it’s obviously an asynchronous action. Event Retention Mode can give SQL Server permission to say it’s too overworked to write the entries and skip them if needed, and I chose to tell SQL Server to drop as many as it wants to if I’d be slowing it down.  It’s all documented in BOL, and it’d be good for you to read through that instead of just listening to me picking out select details.

So, how do you read this? It’s going to put it all in XML, isn’t it!?!?

If you can read this, Kendra Little (b|t) may suggest you’re a demon robot! (While her comment makes me laugh, that post is a great XE reference or it wouldn’t be on here.) Well, she’s probably right in calling this next script names because friendly robots don’t treat your CPU like this. In fact, if you’re on a stressed server or want to do a lot of analysis on this, it’s going to be best to copy the .xel files to a server you care a little less about and shred the XML there.

Unfortunately, I wrote my script to automatically find the files and add a wildcard character, so you’d have to modify my script to run it on another server. The point is getting you started with as little frustration as possible, and this is perfect for that reason. The biggest catch is that the session has to be running for this to work without changes because it’s grabbing the full file name with path from the DMVs for running sessions.

Anyways, here goes….

DECLARE 
	@SessionName SysName 
	, @TopCount Int = 1000

--SELECT @SessionName = 'UserErrors'
SELECT @SessionName = 'DurationOver5Sec'
--SELECT @SessionName = 'system_health'
/* 
SELECT * FROM sys.traces

SELECT  Session_Name = s.name, s.blocked_event_fire_time, s.dropped_buffer_count, s.dropped_event_count, s.pending_buffers
FROM sys.dm_xe_session_targets t
	INNER JOIN sys.dm_xe_sessions s ON s.address = t.event_session_address
WHERE target_name = 'event_file'
--*/

SET STATISTICS IO, TIME ON

IF OBJECT_ID('tempdb..#Events') IS NOT NULL BEGIN
	DROP TABLE #Events
END

IF OBJECT_ID('tempdb..#Queries') IS NOT NULL BEGIN
	DROP TABLE #Queries 
END

DECLARE @Target_File NVarChar(1000)
	, @Target_Dir NVarChar(1000)
	, @Target_File_WildCard NVarChar(1000)

SELECT @Target_File = CAST(t.target_data as XML).value('EventFileTarget[1]/File[1]/@name', 'NVARCHAR(256)')
FROM sys.dm_xe_session_targets t
	INNER JOIN sys.dm_xe_sessions s ON s.address = t.event_session_address
WHERE s.name = @SessionName
	AND t.target_name = 'event_file'

SELECT @Target_Dir = LEFT(@Target_File, Len(@Target_File) - CHARINDEX('\', REVERSE(@Target_File))) 

SELECT @Target_File_WildCard = @Target_Dir + '\'  + @SessionName + '_*.xel'

--SELECT @Target_File_WildCard

SELECT TOP (@TopCount) CAST(event_data AS XML) AS event_data_XML
INTO #Events
FROM sys.fn_xe_file_target_read_file(@Target_File_WildCard, null, null, null) AS F
ORDER BY File_name DESC
	, file_offset DESC 

SELECT  EventType = event_data_XML.value('(event/@name)[1]', 'varchar(50)')
	, Duration_sec = CAST(event_data_XML.value ('(/event/data[@name=''duration'']/value)[1]', 'BIGINT')/CASE WHEN event_data_XML.value('(event/@name)[1]', 'varchar(50)') LIKE 'wait%' THEN 1000.0 ELSE 1000000.0 END as DEC(20,3)) 
	, CPU_sec = CAST(event_data_XML.value ('(/event/data[@name=''cpu_time'']/value)[1]', 'BIGINT')/1000000.0 as DEC(20,3))
	, physical_reads_k = CAST(event_data_XML.value ('(/event/data  [@name=''physical_reads'']/value)[1]', 'BIGINT')/1000.0 as DEC(20,3))
	, logical_reads_k = CAST(event_data_XML.value ('(/event/data  [@name=''logical_reads'']/value)[1]', 'BIGINT') /1000.0 as DEC(20,3))
	, writes_k = CAST(event_data_XML.value ('(/event/data  [@name=''writes'']/value)[1]', 'BIGINT')/1000.0 as DEC(20,3))
	, row_count = event_data_XML.value ('(/event/data  [@name=''row_count'']/value)[1]', 'BIGINT')
	, Statement_Text = ISNULL(event_data_XML.value ('(/event/data  [@name=''statement'']/value)[1]', 'NVARCHAR(4000)'), event_data_XML.value ('(/event/data  [@name=''batch_text''     ]/value)[1]', 'NVARCHAR(4000)')) 
	, TimeStamp = DateAdd(Hour, DateDiff(Hour, GetUTCDate(), GetDate()) , CAST(event_data_XML.value('(event/@timestamp)[1]', 'varchar(50)') as DateTime2))
	, SPID = event_data_XML.value ('(/event/action  [@name=''session_id'']/value)[1]', 'BIGINT')
	, Username = event_data_XML.value ('(/event/action  [@name=''server_principal_name'']/value)[1]', 'NVARCHAR(256)')
	, Database_Name = DB_Name(event_data_XML.value ('(/event/action  [@name=''database_id'']/value)[1]', 'BIGINT'))
	, client_app_name = event_data_XML.value ('(/event/action  [@name=''client_app_name'']/value)[1]', 'NVARCHAR(256)')
	, client_hostname = event_data_XML.value ('(/event/action  [@name=''client_hostname'']/value)[1]', 'NVARCHAR(256)')
	, result = ISNULL(event_data_XML.value('(/event/data  [@name=''result'']/text)[1]', 'NVARCHAR(256)'),event_data_XML.value('(/event/data  [@name=''message'']/value)[1]', 'NVARCHAR(256)'))
	, Error = event_data_XML.value ('(/event/data  [@name=''error_number'']/value)[1]', 'BIGINT')
	, Severity = event_data_XML.value ('(/event/data  [@name=''severity'']/value)[1]', 'BIGINT')
	, EventDetails = event_data_XML 
INTO #Queries
FROM #Events

SELECT q.EventType
	, q.Duration_sec
	, q.CPU_sec
	, q.physical_reads_k
	, q.logical_reads_k
	, q.writes_k
	, q.row_count
	, q.Statement_Text
	, q.TimeStamp
	, q.SPID
	, q.Username
	, q.Database_Name
	, client_app_name = CASE LEFT(q.client_app_name, 29)
					WHEN 'SQLAgent - TSQL JobStep (Job '
						THEN 'SQLAgent Job: ' + (SELECT name FROM msdb..sysjobs sj WHERE substring(q.client_app_name,32,32)=(substring(sys.fn_varbintohexstr(sj.job_id),3,100))) + ' - ' + SUBSTRING(q.client_app_name, 67, len(q.client_app_name)-67)
					ELSE q.client_app_name
					END  
	, q.client_hostname
	, q.result
	, q.Error
	, q.Severity
	, q.EventDetails
FROM #Queries q
--WHERE eventtype NOT IN /*rather typical filtering*/ ('security_error_ring_buffer_recorded', 'sp_server_diagnostics_component_result', 'scheduler_monitor_system_health_ring_buffer_record')
	--AND eventtype NOT IN /*specific troubleshooting filtering*/ ('connectivity_ring_buffer_recorded', 'wait_info')
ORDER BY TimeStamp DESC 

The top is all I typically edit. The Session Name is ‘DurationOver5Sec’ for this purpose, but as you can see it can also read some of the information from the system_health session. The TopCount is just saying I’m only going to look at the most recent 1,000 records BEFORE I shred and filter it, mostly because I love my CPU and this changes how much XML I’m throwing at it.

No matter how I write this to filter before playing with XML or try to be 100% safe, my scripts will not be perfect for you.  In fact they may crash your server. Unfortunately, I’m only half kidding, because nothing is 100%. The space is limited to 50 MB, the overhead of writing to this file should be fine since we’re only working with events that took over 5 seconds asynchronously with data loss allowed, so I don’t foresee any issues in most cases unless you change these numbers. However, reading them gets expensive and you have to use the most caution here.  Keep in mind that you can put the .xel files on any server with SQL installed, even developer edition, and query it.

Why’d I write this and what else is going through my head?

The inspiration for this post actually came from a question a former coworker asked me quite a while ago, just seeing if I knew a lot about Extended Events.  At the time the technically correct answer was “I don’t know”, but instead I told him that although I didn’t have experience with Extended Events that he could look at Jonathan Kehayias’s (b|t) blog, specifically his XEvent A Day Series.  However, I also warned him that Jonathan’s work tends to go deeper than a beginner is prepared for and that he should start with his coworker, Erin Stellato’s (b|t), version that is easier to start with, specifically her Making the Leap From Profilers to Extended Events session she made available on YouTube. This actually inspired two blog posts, I just haven’t written the How to Say “I don’t know” Better post yet.

More Links

It is so wrong that I originally posted this without linking to Erin Stellato’s Extended Events Stairway Series on SQL Server Central.  There, problem is fixed.

Have fun, experiment (with queries), and ask questions.

Optional Parameters Causing Index Scans

Optional parameters in a stored procedure often lead to scans in the execution plan, reading through the entire table, even if it’s obvious that the right index is in place. This is extremely common in procs that are used behind search screens where, for example, you could search for a person according to their first name, last name, city, state, zip code, gender, etc.

To take a simplified look at this, make a quick and easy table consisting of an indexed identity column for us to search by and fluff to make the row size bigger.

CREATE TABLE Test 
(
    ID Int NOT NULL Identity(1,1) PRIMARY KEY
    , Value CHAR(500) NOT NULL
)
GO

INSERT INTO Test (Value)
SELECT '';
GO 250

INSERT INTO Test (Value)
SELECT TOP (1000) Value 
FROM Test 
GO 100

Now we’ll create a proc to get data. In this proc we’ll get the data several different ways, showing the advantages and disadvantages of each method.  You’ll notice that I put my comments as PRINT statements, which will make it easier for you to read through the messages tab and see what’s going on.

CREATE PROC proc_Testing 
    @ID int = 125
    , @MinID int = 100
    , @MaxID int = 150
AS 

SET STATISTICS IO ON
SET NOCOUNT ON

PRINT 'Clustered index scan, because the query optimizer has to be prepared for both null and non-null values'

SELECT *
FROM Test 
WHERE @ID = Test.ID OR @ID IS NULL

PRINT ''
PRINT 'It''s a small mess, but the query optimizer knows exactly what to expect for each query.'

IF @ID IS NOT NULL BEGIN
    SELECT *
    FROM Test 
    WHERE @ID = Test.ID 
END ELSE BEGIN
    SELECT * 
    FROM Test
END 

PRINT ''
PRINT 'Expand that to two possible parameters and it still looks simple right now, when it''s doing a scan'
SELECT *
FROM Test 
WHERE (ID >= @MinID OR @MinID IS NULL)
    AND (ID <= @MaxID OR @MaxID IS NULL)
    
PRINT ''
PRINT 'Make it optimized with IF statements and it quickly becomes a big mess.'  
PRINT 'Many "search screen" queries will have 20 or more optional parameters, making this unreasonable'

IF @MinID IS NOT NULL BEGIN
    IF @MaxID IS NOT NULL BEGIN
        SELECT * 
        FROM Test 
        WHERE ID BETWEEN @MinID and @MaxID 
    END ELSE BEGIN
        SELECT *
        FROM Test 
        WHERE ID >= @MinID 
    END
END ELSE BEGIN
    IF @MaxID IS NOT NULL BEGIN
        SELECT * 
        FROM Test 
        WHERE ID <= @MaxID 
    END ELSE BEGIN
        SELECT *
        FROM Test 
    END
END

PRINT ''
PRINT 'However, the query optimizer can get around that if it''s making a one-time use plan'

SELECT *
FROM Test 
WHERE (ID >= @MinID OR @MinID IS NULL)
    AND (ID <= @MaxID OR @MaxID IS NULL)
OPTION (RECOMPILE)

PRINT ''
PRINT 'And again with the single parameter'

SELECT * 
FROM Test
WHERE ID = @ID OR @ID IS NULL 
OPTION (RECOMPILE)

PRINT ''
PRINT 'However, this leaves two nasty side effects.'
PRINT 'First, you create a new plan each time, using CPU to do so.  Practically unnoticed in this example, but it could be in the real world.'
PRINT 'Second, you don''t have stats in your cache saying how indexes are used or what your most expensive queries are.'
PRINT ''
PRINT 'Another option is dynamic SQL, which still has most of the first flaw, and can also bloat the cache'

DECLARE @Cmd NVarChar(4000)

SELECT @Cmd = 'SELECT * FROM Test WHERE 1=1'

IF @ID IS NOT NULL BEGIN
    SELECT @Cmd = @Cmd + ' AND ID = ' + CAST(@ID AS VarChar(100))
END

IF @MinID IS NOT NULL BEGIN
    SELECT @Cmd = @Cmd + ' AND ID >= ' + CAST(@MinID AS VarChar(100))
END

IF @MaxID IS NOT NULL BEGIN
    SELECT @Cmd = @Cmd + ' AND ID <= ' + CAST(@MaxID AS VarChar(100))
END

EXEC (@Cmd) 

PRINT ''
PRINT 'Yes, you can do sp_executesql which can be parameterized, but it gets more difficult.'

Now that we have the data and proc, just execute it. It will be best if you add the actual execution plans to this, which you can get to on your menu going to Query / Include Actual Execution Plan. If you don’t know how to read execution plans then this is even better! No experience necessary with plans this simple, and you’ll start to feel more comfortable around them.

EXEC Proc_Testing

Even with the default values for the parameters the query optimizer knows that you could have easily passed in NULL for the values, and it has to plan for everything. Lets step through the results to see what this all means.  Part of that planning for everything is saying that @ID IS NULL will be used instead of ID = @ID, so the query optimizer can’t say for sure that it can just perform a seek on that column.

In the messages tab we have the number of reads done by each statement courtesy of me adding SET STATISTICS IO ON in the proc itself (bad idea in prod, by the way). For the first one we have 7272 logical reads, saying we read 7272 pages of 8kb of data, so we had ask the CPU to play around with over 56 MB of data to find records that matched.

Looking at the execution plan we can see why that happened. The Predicate you can think about as the “Scan Predicate”, since it’s saying what you couldn’t seek for and had to scan instead. In this case it’s showing the entire “@ID = Test.ID OR @ID IS NULL” in there, because it compiled a reusable plan that might be used with a NULL.

Execution Plan of Query 1

In the next statement we were able to do a seek, doing only 3 reads. This is because there are two levels of the B+tree on this index, so it read the root level, then the next level of the B+tree, and finally the single leaf level of the index that contained the data we wanted.

Take a look at the execution plan here to see the difference with not only the Seek itself, but the Seek Predicate in the details. You’ll see that it uses @ID in there still showing that it’s a reusable plan ready for any ID to be passed in, but the WHERE clause is telling the query optimizer that it can always use a seek to find this data.

Execution Plan of Query2

Now that I know you can read through a couple yourself, I’ll skip ahead to the 6th query where we used the same “@ID = Test.ID OR @ID IS NULL” that caused is trouble before, but did OPTION (RECOMPILE) at the end of the statement. Again it did the same 3 reads I just mentioned still using a seek, but the details of the execution plan looks different. The seek predicate used to say @ID so it could be reused, but the query optimizer knows nothing with OPTION (RECOMPILE) will get reused. Knowing that, it simply converted @ID into a constant value of 125 and was able to eliminate the possibility of 125 being NULL.

Execution Plan of Query 6

If you want to get more into the details, you can look at the XML version of the execution plan by right-clicking on the plan and selecting “Show Execution Plan XML…”. Here’s what you’ll find for the parameter’s value in the first two queries. It shows that the value that was sniffed when it was compiled was 125, and also that it was run this time with a value of 125. If you ran this again passing 130 in then you’d see the sniffed value staying at 125 because it’s not going to use CPU resources to recompile it, but the runtime value will be 130 for that run.

<ParameterList>
  <ColumnReference Column="@ID" ParameterCompiledValue="(125)" ParameterRuntimeValue="(125)" />
</ParameterList>

The OPTION(RECOMPILE) versions don’t look like this though, they’re changed to a constant value even at this level.

<RangeColumns>
  <ColumnReference Database="[tempdb]" Schema="[dbo]" Table="[Test]" Column="ID" />
</RangeColumns>
<RangeExpressions>
  <ScalarOperator ScalarString="(125)">
    <Const ConstValue="(125)" />
  </ScalarOperator>
</RangeExpressions>

I hope I left you with a better understanding of what happens when you write code for parameters that could be null. We’ve all done this, and many of us (me especially) have been frustrated with the performance. This is a change I put into production not too long ago that ended scans on a rather large table, and the results were noticed in query execution time, the page life expectancy counter since the entire table was no longer being read into memory, and I/O activity levels since that index and the indexes it kicked out of memory didn’t have to be read off of disk nearly as often.

Let me know what you think, and especially if you have a better way of handling this issue.

Why worry about CXPACKET

TSQL2SDAYMany people see CXPACKET at the top of their waits and start trying to fix it. I know this topic’s been done before, but people ask me about it enough that it should be done again, and again. In fact, Brent Ozar wrote an excellent article about it, and Jonathan Kehayias wrote an article about tweaking it using the cost threshold of parallelism. Even with those, it took Grant Fritchey warning us to be careful about giving guidance to lead me to Bob Ward’s take on it.  After all of these people and more saying CXPACKET isn’t what you think it is, enough people have it all wrong to the point that I felt this was the biggest piece of public opinion to speak out against for Michael Swart’s T-SQL Tuesday #052.

BOL still doesn’t state it completely clear when it defines it as “Occurs with parallel query plans when trying to synchronize the query processor exchange iterator. If waiting is excessive and cannot be reduced by tuning the query (such as adding indexes), consider adjusting the cost threshold for parallelism or lowering the degree of parallelism.” The true meaning of this wait is much easier, with Bob Ward’s explanation of “This wait type only means a parallel query is executing.”

Yes, that’s it, it’s not really all that complex. If you have a MAXDOP of 4 then you could end up with 5 threads. Think of it as having one manager who can delegate work out to 4 subordinates. The subordinates do their pieces of the job and the manager marks down CXPACKET on his time sheet while he waits for them. When they finish, the manager compiles their work (repartitions the streams if you want). There was a little extra work done here because the manager wouldn’t have to combine all the work if he did it all on his own (MAXDOP = 1), and it’s possible the subordinates did more work than they had to. However, in most cases, it does get done faster, and duration is what all your users talk about.

The advice in BOL above saying “consider adjusting the cost threshold for parallelism or lowering the degree of parallelism” is incomplete at best. Upping the cost threshold is exactly what it sounds like, making it so only more expensive tasks can be assigned to those subordinates. Then lowering the degree of parallelism is just dropping how many subordinates you can use.

Cost Threshold for Parallelism is something Brent Ozar makes fun of a bit, because it’s a default of 5 units that are undefined anymore. Jeremiah Peschka recommends setting this to 50 and tweaking it from there. I’d recommend 25 for most OLTP because I like parallelism and my procs aren’t stressed. However, the point is that you should only tweak what you understand, and now I hope you have a descent understanding of this. If you have a lot moderately large queries you wish could break out the work to get it done faster, drop it. If all of your CPUs are running hot and you wish less work was being done repartitioning streams or compiling more complex plans, raise it.

Max Degree of Parallelism is what people really like to tweak, and it’s usually a bad idea. My personal recommendation is to set it to 4 in OLTP (higher in OLAP, very dependent on your load) and forget it unless you have a really, really good reason to change it. The default of 0 is absolutely horrible for OLTP on larger servers, where this could mean that you’re breaking out a task and assigning it to 80 or more subordinates, then trying to put all of their work back together, and killing yourself doing it. This shouldn’t be above 8 unless you really like to be overworked putting your subordinates’ work back together and dealing with those performance problems. However, it’s great to have subordinates who can help you out when needed, so please don’t drop this below 4 unless you have an amazing reason to do so, and only on the query level if you only have one amazing reason.

So, what do you do when CXPACKET is taking over? The trick is to think of it in terms of how a business would work. You have a ton of work to do, enough where your managers are going crazy trying to find subordinates to do it for them. Do you tell your managers to do it themselves OPTION(MAXDOP=1), do you tell them to go out and find as many subordinates as they can OPTION(MAXDOP=0), or do you tell them you’ll see if you can help them find a more efficient way to do their jobs?

If you have the Cost Threshold for Parallelism set to 25 or 50 you have a descent limit before you consider spreading the load around. So, what takes that long for your server to handle? A good portion of the time you’ll find this when you’re scanning a large index or table, or even doing a very expensive seek. If you look at your execution plan is it doing a scan? If it’s a seek that’s starting your parallelism then does it have a small “Seek Predicate” and a lot to do in the “Predicate” in the properties for that operator? It could be that you could use better indexes, it could be that you could find a more SARGable approach, or a variety of other performance tuning opportunities.

The thing is that parallelism isn’t bad and CXPACKET is saying you’re using a good thing. A high CXPACKET could mean you’re trying to use too much of a good thing because you’re “overworking your managers”, but the workload is typically more of an issue than the fact that you let your manager delegate their work when there’s enough to go around. A CXPACKET a lot higher than your baseline could mean that you have poor statistics or parameter sniffing that’s causing a bad execution plan, or it could mean you have a new query that could use some attention.  When you’re talking about parallelism it’s also possible that the statistics were off and one thread (subordinate) ends up doing 99% of the work, making CXPACKET jump up, and that can be found in the actual execution plans; read more about that in Grant Fritchey’s book.

If you have a MAXDOP around 4 (between 2 and 8, reading these recommendations) and Cost Threshold of 25 or higher then I’d be looking into the workload more than the fact that you’re using parallelism. Sure, some tasks just don’t take well to parallelism and there’s reasons to use a MAXDOP=1 hint, but it’s rare to need to take it down to 2 on the server level and even more rare to turn if off by taking it down to 1.

What ever you do, when you have “a big query using parallelism”, try to focus on “a big query” first, it’s usually the problematic part of that statement.

Related articles

Deadlock – A quick, easy view

Deadlocks are rough to work with. Here are the scripts I use to capture deadlocks, find which ones are reoccurring, and view them along with a couple free eBooks to resolve them.

You could have thousands of deadlocks and it would take you forever to find out which ones are reoccurring or which ones are some freak accident with an annual process. I used to read through deadlock graphs one-by-one to see what was reoccurring, and I used to be less satisfied with my job as well. If you’re going to bang your head on your desk making sure a deadlock never happens again, you’ll want to make sure it wasn’t a one-time event that wouldn’t have happened again anyways.

I’m not going to get into how to figure out deadlocks, that’s a chapter in a book more than it’s a blog post. Chapter 7 to be exact in the FREE eBook or $25 physical book for Accidental DBAs by Jonathan Kehayias and Ted Krueger. Also, a whole book on blocking by Kalen Delaney in a FREE eBook or $22 physical book. I have to admit that Ted Krueger isn’t a name I recognize. However, Jonathan and Kalen are easily on my list of top 5 best MVPs out there.

Anyways, back to me. Here’s what I use to look at deadlock traces. The base code was found on the internet years ago, and you can find it in several places now. Because of that I have no idea who the original author is, but I’d be glad to throw up credit here for anyone who can show me a site dated older than when I started using it.

There are two versions here, almost identical code in each. The first one summarizes the deadlocks and gives you a count of the occurrences. The second one shows each SPID involved in the deadlock separately along with the XML for the deadlock.

DECLARE @Path VarChar(500);
SET @Path = (SELECT TOP 1 [path] FROM sys.traces WHERE [path] LIKE '%deadlock%')
--SET @Path = 'D:\Perflogs\PerfTraces\DeadlockTrace.trc'

;with CTE as
(
select 
 [TraceID] = 3, 
 [RowID] = row_number() OVER (ORDER BY StartTime), -- assign a row number to each deadlock
 [DeadlockGraph]=case when TextData like '<deadlock-list%' then convert(xml, TextData) else null end, 
 * 
 from ::fn_trace_gettable(@path, default)
where TextData like '<deadlock-list%'
    --AND StartTime BETWEEN '2013-06-17 00:00' AND '2013-06-30 00:00'
)
SELECT [Procedure], Inputbuffer, dMonth = DatePart(Month, DeadLockTime), dDay = DatePart(Day, DeadLockTime), DeadlockCount = Count(*), dMax = max(DeadlockTime), dMin = min(DeadlockTime)
FROM
(
select 
 [TimeoutID] = CTE.RowID,
 [DeadlockTime] = [StartTime],
 [DeadlockGraph],
 [PagelockObject] = CTE.[DeadlockGraph].value('/deadlock-list[1]/deadlock[1]/resource-list[1]/pagelock[1]/@objectname', 'varchar(200)'),
 [DeadlockObject] = CTE.[DeadlockGraph].value('/deadlock-list[1]/deadlock[1]/resource-list[1]/objectlock[1]/@objectname', 'varchar(200)'),
 [Victim] = case when Deadlock.Process.value('@id', 'varchar(50)') = CTE.[DeadlockGraph].value('/deadlock-list[1]/deadlock[1]/@victim', 'varchar(50)') then 1 else 0 end,
 [Procedure] = Deadlock.Process.value('executionStack[1]/frame[1]/@procname[1]', 'varchar(200)'),
 [LockMode] = Deadlock.Process.value('@lockMode', 'char(1)'),
 [Code] = Deadlock.Process.value('executionStack[1]/frame[1]', 'varchar(1000)'),
 [ClientApp] = Deadlock.Process.value('@clientapp', 'varchar(100)'),
 [HostName] = Deadlock.Process.value('@hostname', 'varchar(20)'),
 [HostPID] = Deadlock.Process.value('@hostpid', 'varchar(20)'),
 [LoginName] = Deadlock.Process.value('@loginname', 'varchar(20)'),
 [TransactionTime] = Deadlock.Process.value('@lasttranstarted', 'datetime'),
 [InputBuffer] = Deadlock.Process.value('inputbuf[1]', 'varchar(1000)')
 from CTE
 CROSS APPLY CTE.[DeadlockGraph].nodes('/deadlock-list/deadlock/process-list/process') as Deadlock(Process)
) X
--WHERE Victim = 0 
--WHERE TimeoutID IN (SELECT RowID FROM CTE WHERE [PROCEDURE] = 'master.dbo.FakeProcName')
--WHERE inputbuffer like '%select top 10%'
GROUP BY [procedure], Inputbuffer, DatePart(Month, DeadLockTime), DatePart(Day, DeadLockTime)
--ORDER BY TimeoutID 

Then there’s this to actually let me look at the XML. Although you can easily see in the script below which deadlocks reoccur back-to-back, it’s not so easy to see reoccurrence of deadlocks that happen once every morning between 2 and 3 AM. That’s where the first script shines, and you should use and abuse it.

DECLARE @Path VarChar(500);
SET @Path = (SELECT TOP 1 [path] FROM sys.traces WHERE [path] LIKE '%deadlock%');

with CTE as
(
select 
 [TraceID] = 3, 
 [RowID] = row_number() OVER (ORDER BY StartTime), -- assign a row number to each deadlock
 [DeadlockGraph]=case when TextData like '<deadlock-list%' then convert(xml, TextData) else null end, 
 * 
 from ::fn_trace_gettable(@Path, default)
where TextData like '<deadlock-list%'
    --AND StartTime BETWEEN '2013-03-08 02:00' AND '2013-03-08 04:00'
    AND StartTime > DATEADD(Hour, -2, GetDate())
)
SELECT *
FROM
(
select 
 [TimeoutID] = CTE.RowID,
 [DeadlockTime] = [StartTime],
 [DeadlockGraph],
 [PagelockObject] = CTE.[DeadlockGraph].value('/deadlock-list[1]/deadlock[1]/resource-list[1]/pagelock[1]/@objectname', 'varchar(200)'),
 [DeadlockObject] = CTE.[DeadlockGraph].value('/deadlock-list[1]/deadlock[1]/resource-list[1]/objectlock[1]/@objectname', 'varchar(200)'),
 [Victim] = case when Deadlock.Process.value('@id', 'varchar(50)') = CTE.[DeadlockGraph].value('/deadlock-list[1]/deadlock[1]/@victim', 'varchar(50)') then 1 else 0 end,
 [Procedure] = Deadlock.Process.value('executionStack[1]/frame[1]/@procname[1]', 'varchar(200)'),
 [LockMode] = Deadlock.Process.value('@lockMode', 'char(1)'),
 [Code] = Deadlock.Process.value('executionStack[1]/frame[1]', 'varchar(1000)'),
 [ClientApp] = CASE LEFT(Deadlock.Process.value('@clientapp', 'varchar(100)'), 29)
                    WHEN 'SQLAgent - TSQL JobStep (Job '
                        THEN 'SQLAgent Job: ' + (SELECT name FROM msdb..sysjobs sj WHERE substring(Deadlock.Process.value('@clientapp', 'varchar(100)'),32,32)=(substring(sys.fn_varbintohexstr(sj.job_id),3,100))) + ' - ' + SUBSTRING(Deadlock.Process.value('@clientapp', 'varchar(100)'), 67, len(Deadlock.Process.value('@clientapp', 'varchar(100)'))-67)
                    ELSE Deadlock.Process.value('@clientapp', 'varchar(100)')
                    END ,
 [HostName] = Deadlock.Process.value('@hostname', 'varchar(20)'),
 [LoginName] = Deadlock.Process.value('@loginname', 'varchar(20)'),
 [TransactionTime] = Deadlock.Process.value('@lasttranstarted', 'datetime'),
 [InputBuffer] = Deadlock.Process.value('inputbuf[1]', 'varchar(1000)')
 from CTE
 CROSS APPLY CTE.[DeadlockGraph].nodes('/deadlock-list/deadlock/process-list/process') as Deadlock(Process)
-- ORDER BY [DeadlockObject], [ClientApp], [Procedure], [Code]
) X
--WHERE Victim = 0 
--WHERE [Procedure] = 'master.dbo.FakeProcedureName'
ORDER BY TimeoutID DESC

Finally, to make all of this happen you’ll need a deadlock trace. Don’t go thinking that I open profiler, make a deadlock trace, script it out, and run it every time I need one. Reusable code is awesome, and this is reused every time I see an alert come through that we are having too many deadlocks. I have this proc in our Perf database, which is on every SQL Server we manage. So you don’t have to dig through the numbers, it grabs every event for the deadlock graph and nothing else.

IF  EXISTS (SELECT * FROM sys.objects WHERE object_id = OBJECT_ID(N'[dbo].[usp_ServerSideTrace_Deadlock]') AND type in (N'P', N'PC'))
DROP PROCEDURE [dbo].[usp_ServerSideTrace_Deadlock]
GO

SET ANSI_NULLS ON
GO

SET QUOTED_IDENTIFIER ON
GO

CREATE procedure [dbo].[usp_ServerSideTrace_Deadlock]
    @FilePath nvarchar(1000) = N'D:\Perflogs\PerfTraces\DeadlockTrace',                                            
    @maxfilesize bigint = 25,
    @maxfiles int = 10,
    @TraceDBID bit=0,
    @DBID int=0
AS

declare @rc int
declare @TraceID int

--Create Trace
exec @rc = sp_trace_create @TraceID output, 2, @FilePath, @maxfilesize, NULL, @maxfiles
if (@rc != 0) 
Begin
    select ErrorCode=@rc    
    return
End

-- Set the RPC Completed and SQL Batch Completed events
declare @on bit
set @on = 1
exec sp_trace_setevent @TraceID, 148, 11, @on
exec sp_trace_setevent @TraceID, 148, 12, @on
exec sp_trace_setevent @TraceID, 148, 14, @on
exec sp_trace_setevent @TraceID, 148, 1, @on
exec sp_trace_setevent @TraceID, 25, 15, @on
exec sp_trace_setevent @TraceID, 25, 8, @on
exec sp_trace_setevent @TraceID, 25, 32, @on
exec sp_trace_setevent @TraceID, 25, 56, @on
exec sp_trace_setevent @TraceID, 25, 1, @on
exec sp_trace_setevent @TraceID, 25, 9, @on
exec sp_trace_setevent @TraceID, 25, 57, @on
exec sp_trace_setevent @TraceID, 25, 2, @on
exec sp_trace_setevent @TraceID, 25, 10, @on
exec sp_trace_setevent @TraceID, 25, 3, @on
exec sp_trace_setevent @TraceID, 25, 11, @on
exec sp_trace_setevent @TraceID, 25, 12, @on
exec sp_trace_setevent @TraceID, 25, 13, @on
exec sp_trace_setevent @TraceID, 25, 6, @on
exec sp_trace_setevent @TraceID, 25, 14, @on
exec sp_trace_setevent @TraceID, 25, 22, @on
exec sp_trace_setevent @TraceID, 59, 32, @on
exec sp_trace_setevent @TraceID, 59, 56, @on
exec sp_trace_setevent @TraceID, 59, 1, @on
exec sp_trace_setevent @TraceID, 59, 57, @on
exec sp_trace_setevent @TraceID, 59, 2, @on
exec sp_trace_setevent @TraceID, 59, 14, @on
exec sp_trace_setevent @TraceID, 59, 22, @on
exec sp_trace_setevent @TraceID, 59, 3, @on
exec sp_trace_setevent @TraceID, 59, 12, @on

-- Set the Filters
--Default to exclude the trace from Tracing Itself
exec sp_trace_setfilter @TraceID, 10, 0, 7, N'SQL Server Profiler'

--Add other filters as specified by parameters
If @TraceDBID=1
    exec sp_trace_setfilter @TraceID, 3, 0, 0, @DBID

-- Set the trace status to start
exec sp_trace_setstatus @TraceID, 1

-- display trace id for future references
return @TraceID

GO

The basics of a deadlock is that process 1 gets a lock on data A while process 2 gets a lock on data B. Then process 1 says it needs a lock on data B to continue while process 2 needs a lock on data A to continue. It’s a simple basic concept, but it gets complex…too complex for me to cover it here and say I did it justice. Sometimes a process deadlocks on itself, doing a parallelism deadlock as demonstrated by Jason Strate. Solutions also vary from order of operations (lets make processes 1 and 2 both get data A first, then they can’t deadlock), tuning (if the locks are released quicker then there’s less time for deadlocks), reducing the number of transactions (the lock on data A was grabbed earlier in this transaction, and there’s no reason these need to be in a explicit transaction), scheduling (these are both processes that have to run between 10 PM and 6 AM, why do they both start at midnight?), and many other approaches. There isn’t one right answer, and anyone promising a single right answer in one short blog post is selling you short. That’s either a very long blog post or it’s an incomplete answer. I go with option 3, and here’s my post on the best way to view them along with a couple book chapters to get you started on fixing what you found.

Related Content:

SQL Server Concurrency: Locking, Blocking and Row Versioning By Kalen Delaney
FREE eBook or $22 physical book

Troubleshooting SQL Server: A Guide for the Accidental DBA By Jonathan Kehayias and Ted Krueger
FREE eBook or $25 physical book

SQL Server Running Slow

A user calls to say the app or server is slow today.  Here’s a quick summary of how I get started.  It depends on monitoring where you can compare baselines to recent activity, and I include links to all of that code I use.

The initial question is too vague.  You can’t blame this individual user because this is how 95% of issues make it to you.   The initial follow-up will be the following questions I ask the user along with the corresponding question your boss is asking you:

  • Can anyone else duplicate your issue?
    • Is this the user’s machine or a server issue?  Not a 100% conclusive answer, but it’s a start.
  • Is everything running slow or just one process or screen?
    • Is the whole server running slow or just one stored procedure?
  • Were any changes made to the system recently?  Depending on the user, this may be a question for someone else.
    • Did we cause it by making a change or did this just come up?

However, this is enough for me to do a very quick overall health check while I wait for those answers.  It seems like a lot at first glance, but it’s practically automated with the scripts I have on hand.  This is only opening 5 pre-written scripts, running them, and peeking at the results.

Quick Health:

  • Look at historical wait stats for the last two hours and the same time window both 1 and 7 days ago.  Documented in the Wait Stats post.
  • Look at memory and CPU contention for the same times as wait stats.  You’re specifically looking for high CPU usage, PLE drops, and changes to target memory. Documented in the OS Performance Counters post.
  • Look for blocking in the last hour, even though it would typically show up in wait stats.  You can compare this to previous days if needed, Documented in the Blocking post
  • Look at the large queries that completed in the last two hours along with the queries currently running to see if anything pops out.  This is just a quick glance looking for glaring issues, and you can look for details after getting answers to the follow-up questions.  Unfortunately, this information isn’t as cut-and-dry as the rest, and it’s going to rely on you being a little familiar with what normal is on this server.  Completed queries are documented in the Tracing Creation and Reading posts, and currently running queries are documented in the Running Processes post.
  • Look at the queries recompiled recently to see if a new execution plan is taking excessive resources.  Documented in the Recently Recompiled Resource Hogs post.

So, where do you go from here?  Yeah, you get the typical “it depends” answer from me.  The information you just looked at will normally comes up with something that doesn’t look right and needs to be looked into further.  However, there are so many directions this can go from here that a single document can’t cover it.  The purpose of this post is simply to answer the question “Where do I start looking with the most common question a user throws at me”, nothing more.  Also, I wanted a way to tie all of the random posts together so you could see them working together as the full solution.