File Growths

I hinted at file growths in my previous posts about shrinking data and log files.  Then I talked about growing log files in my post Database Log VLFs.  However, there are still some unanswered questions about growing data files.

Should I use autogrowth?  What should I set it to grow by?

Why do manual growths, and how do I know how much to grow by or when a growth is needed?

Can I and should I use Instant File Initialization?  If I can and should, how do I even know if it’s turned on?

Leave Autogrowth On?

Yes, absolutely.  This isn’t a question.

This could be worded as “Do you want a slight pause or do you want your application to fail?”  The answer is a little more obvious when you word it that way.  The only time I’ve seen an appropriate answer of “No” is when you have multiple data files in a filegroup and only want one to grow.

To answer how long this pause will be you have to ask these two questions.  Are you able to use Instant File Initialization?  How much are you growing by if you can’t use Instant File Initialization?  I’ll discuss Instant File Initialization later in this post, but it’s basically the difference between “this space is yours immediately” instead of writing zeros SQL Server doesn’t care about to be paranoid about security.

There are competing factors as to how much you want to autogrowth to be.  The only real consensus is that the defaults are horrible.  You need to balance out how long of a pause it will take for a growth, how long of a pause your users will tolerate, how fast is your database growing, how much fragmentation smaller growths will cause, and how much fragmentation you will tolerate.

By default, data files grow at 1 MB and log files grow at 10%.  I covered log file growths rather well in my post Database Log VLFs, so we’ll focus on the data files here.  Think about it, if you have a 100 GB database that got there by the defaults, it got there in 102,400 pieces.  Not good.

If the defaults are horrible, what’s good?  Tiny is bad, huge is bad, and percentage-based growth just lets you automatically drift from tiny to huge.  Do your balancing act I talked about above.  If growing by 64 MB will keep you good for several weeks, set it to 64 MB.  If 1 GB goes by rather quickly, you can’t use Instant File Initialization, and the users can tolerate the pause it takes to grow by 1 GB, then this might be the best growth rate for you.  No single answer is right, but at least you have a better idea of what the variables are.

There are also cases where there are no good answers.  Say you have an app wouldn’t be uncommon to grow by a couple GB a day, you can’t use Instant File Initialization, and pauses of more than a second wouldn’t go over very well.  You don’t want the fragmentation of setting the growth to 64 MB, but you don’t want the pause of setting it to 1 GB.  Maybe you’ll settle for 256 MB, but you’re not happy about it.  Manual growths are the real answer, but you want a safety net that won’t kill you with pauses or fragmentation.  Not everyone is in that situation, but some of us are.

If I’m going to suggest leaving Autogrowth on and suggest that you be aware of the size of these growths, then the least I can do is give you a script for that.  This will tell you the size of every database file and the autogrowth rate.  I’ll often use it to tweak the growth rates, so I script that change out in the results as well.  If you read the post Database Log VLFs then it will make more sense why I use 1,000 MB here instead of 1,024 MB; it wasn’t a typo.

DECLARE @FilterByDB VarChar(100)
	, @Cmd NVarChar(4000)

SELECT @FilterByDB = ''
--SELECT @FilterByDB = 'tempdb'

IF Object_ID('TempDB..##FileSize') IS NOT NULL BEGIN
	DROP TABLE ##FileSize
END

CREATE TABLE ##FileSize
(	  DB VarChar(128)
	, FileLogicalName VarChar(128)
	, FilePhysicalName VarChar(512)
	, FileGroup VarChar(128)
	, Used_MB VarChar(128)
	, Free_MB VarChar(128)
	, Size_MB VarChar(128)
	, GrowthRate VarChar(128)
	, MaxSize VarChar(128)
)


SELECT @Cmd =  N'use [?]; 

IF ''?'' like ''' + @FilterByDB + '%'' OR ''' + @FilterByDB + ''' = '''' BEGIN 
INSERT INTO ##FileSize
SELECT DB = db_name()
	, FileLogicalName = f.name
	, FilePhysicalName = f.physical_name
	, FileGroup = ISNULL(g.name, f.Type_Desc) 
	, Used_MB = REPLACE(CONVERT(varchar(100), (CAST((FileProperty(replace(f.name, '''', ''''''''), ''SpaceUsed'')) / 128 AS money)), 1), ''.00'', '''')
	, Free_MB = REPLACE(CONVERT(varchar(100), (CAST((f.size - FileProperty(f.name, ''SpaceUsed'')) / 128 AS money)), 1), ''.00'', '''')
	, Size_MB = REPLACE(CONVERT(varchar(100), (CAST((f.size) / 128 AS money)), 1), ''.00'', '''')
	, GrowthRate = Case Is_Percent_Growth
					WHEN 1 THEN '''' + Cast(Growth as VarChar(100)) + ''%''
					ELSE REPLACE(CONVERT(varchar(100), (CAST(Growth/128 AS money)), 1), ''.00'', '''') + '' MB''
					END 
	, MaxSize = Case Max_Size
					WHEN -1 THEN ''---''
					WHEN 268435456 THEN ''---''
					ELSE REPLACE(CONVERT(varchar(100), (CAST(Max_Size/128 AS money)), 1), ''.00'', '''') + '' MB''
					END
FROM sys.database_files f
	LEFT JOIN sys.filegroups g on f.data_space_id = g.data_space_id

END
' 
IF @FilterByDB <> '' AND 100 < (SELECT COUNT(1) FROM sys.databases) BEGIN
	SELECT @Cmd = REPLACE(@Cmd, '?', @FilterByDB)

	EXEC (@Cmd)
END ELSE BEGIN
	exec sp_MSforeachdb @Cmd 
END

SELECT *
	, PctUsed = Cast(100 * replace(Used_MB, ',', '') / (Cast(replace(Size_MB,',', '') as Dec(20,2)) + .01) as Dec(20,2))
	, SetGrowth64MB = 'ALTER DATABASE [' + db + '] MODIFY FILE ( NAME = N''' + FileLogicalName + ''', /*Size = MB,*/ FILEGROWTH = 64MB )'
	, SetGrowthTo256MB = 'ALTER DATABASE [' + db + '] MODIFY FILE ( NAME = N''' + FileLogicalName + ''', /*Size = MB,*/ FILEGROWTH = 256MB )'
	, SetGrowthTo1000MB = 'ALTER DATABASE [' + db + '] MODIFY FILE ( NAME = N''' + FileLogicalName + ''', /*Size = MB,*/ FILEGROWTH = 1000MB )'
FROM ##FileSize
ORDER BY 1, 4, /*cast(replace(size_mb, ',', '') as int) DESC,*/ FilePhysicalName

DROP TABLE ##FileSize

Manual Growths

If you want to be extreme about it, autogrowth is like asking someone about wearing a seatbelt.  Do you want it to hurt a little or a lot if you “crash” by running out of allocated space?  Well, you want it to hurt…wait…why do I have to crash?

This may seem over-the-top, but some of the applications may have databases like the last one I talked about in the autogrowth section.  Typically we’d prefer not to have autogrowth handling everything to avoid the pause while it grows, but there are cases like that where it’s more than a slight preference to avoid the pause.

So the autogrowths are our seatbelts we’re putting on just in case while catching everything with manual growths is our real goal of avoiding that “crash”.  However, how are you supposed to know when to grow a file or how much to grow it?  Seeing how large your files are now doesn’t tell you how much they’ll grow in the next couple months, they could be static or growing exponentially.

The partial answer is to say how much data was used before, how much data is being used now, and predict how much data will be used in the future using that trend.  A better answer is to say what the peak usage was over a week and compare that to past weeks, which would account for things that cause spikes in file usage such as index rebuilds or data loads.

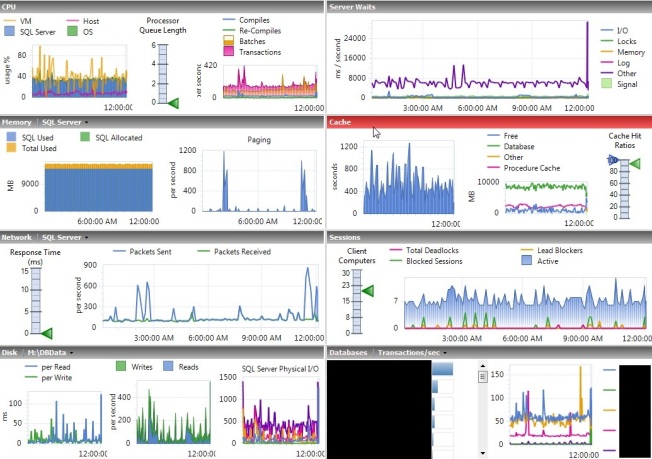
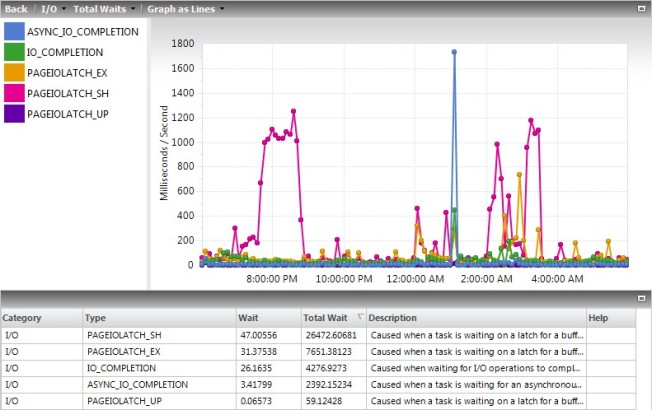
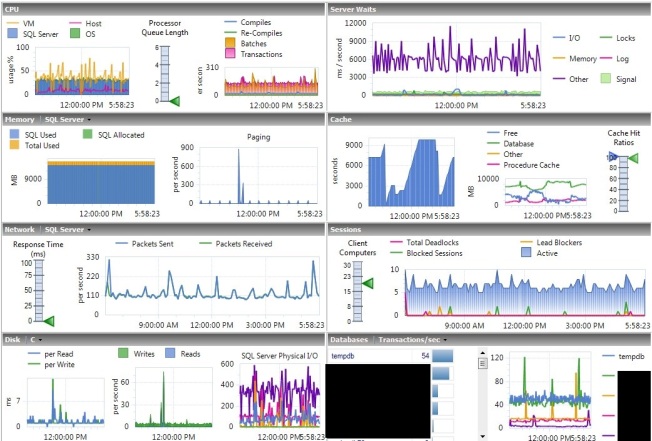
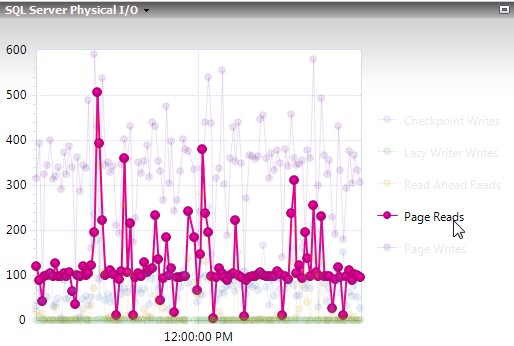
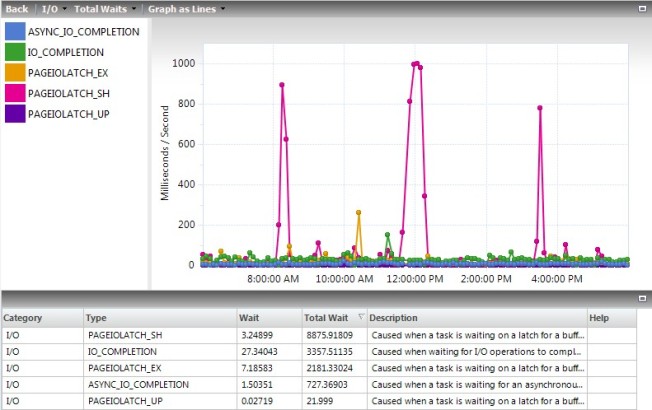
If you have monitoring software, it may have that answer just waiting for you to query it.  That’s the situation I find myself in right now, and I wrote Database Growth Trends – Idera Diagnostic Manager talking about how I handle it right now.  However, I used to work with monitoring software that pretty much only told me OS-level info, so we watched this data manually as was discussed in my post Monitoring Database and Table Sizes.

To be clear, many databases are fine with autogrowth handling everything.  Do what’s best for you for each individual database.  I personally have a mix of databases where some I’d be upset if autogrowth kicked in because it would cause timeouts that the app handles extremely poorly, and others, such as my DBA database, where a pause would only affect my collection jobs or a query I’m personally running.  Autogrowth is not inherently evil, so only be paranoid where paranoia is called for.

Performing Manual Growths

Manually growing the file is just setting a new initial size.  To do that in SSMS, right-click on a database, properties, files, then change the initial size to how large you want it to be.

I’m not a big fan of having SSMS do things for me, so I’ll use “Script Action to New Query Window” and run it form there.  This will give me a script like this:

USE [master]
GO
ALTER DATABASE [DBA] MODIFY FILE ( NAME = N'DBA_Data', SIZE = 256000KB )
GO

One thing I wish I knew about years before I did is that the size in KB also accepts sizes in MB.  I write just about everything in MB, so it’s more natural for me to write that script with Size = 250MB instead.  I know I’m being petty, but I’m petty and comfortable.

This script could take a couple milliseconds or several seconds, even for 250MB.  It all depends on if you have Instant File Initialization turned on and if you’re able to use it for this growth.

Instant File Initialization – What is it?

Short answer, this makes growths exponentially quicker by opening an often-acceptable small security hole.

Of course, I always have a long answer…

By default, all space used by SQL Server is zeroed out before control is handed over.  This makes sure that it’s clean space for two basic reasons.  First, the database requires that space to be clean because of how it plans to use it.  Second, we don’t want to risk the possibility of special commands being able to pull back unencrypted sensitive data that used to be there.

Now the first reason we don’t have much control or say over at this point in the conversation.  If you’re growing a log file then it needs to be zeroed out, and SQL Server will zero out each VLF when it’s marked for reuse, too.  For data files, if you’re using Transparent Data Encryption (TDE) then the way SQL Server stores the data also requires the space to be zeroed out.  These things are outside of the conversation on file growths, it’s just what we’ll have to deal with at this point and SQL Server won’t use IFI even if it’s turned on.

The one thing that will be pulled into this discussion is the security aspect of using uninitialized space.  Kimberly Tripp demonstrates this the best in her post Instant Initialization – Why, Why, and How? in the “Why isn’t this on by default?” section.

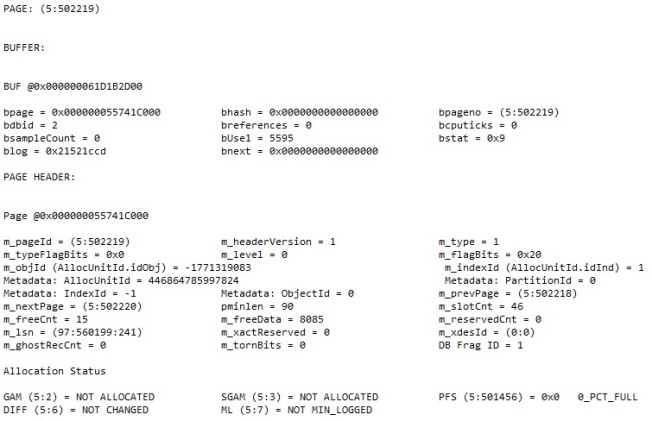
I’ll try to make it short and sweet if you don’t want to read yet another post (I recommend you read it). You can ask SQL Server to read specific pages off the disk.  If SQL Server never actually used that page then it contains what was there when it was given to SQL Server.  Zero initialized disks are very boring info, just “0000000000….”.  Not much fun.

Uninitialized space is more fun (depending on your meaning of the word) and could contain old data.  If you had unencrypted sensitive data sitting there before, it could contain enough to steal someone’s identity.  You never know.  These commands will only work if you have the permissions to run them, but who has those permissions and how much do you trust them?  Most organizations say it’s fine, but some won’t.

Instant File Initialization – How do I use it?

This is an odd feature that you can’t just see in a table in SQL Server.  The easiest way is to run an xp_cmdshell command and look for it, but you can optionally turn on trace flags, grow or create a database, turn off the trace flags, then look in your error log.

Paul Randal gets into both methods in his post How to tell if you have instant file initialization enabled?.  I don’t have any issues with xp_cmdshell, so I’ll let you go to Paul’s blog if your company insists on the more difficult method.

As for me, I’ll run the query below as a multiserver query in SSMS and look at the results.  If that sounds foreign to you, check out my Multiserver Queries post, it’s a very simple and useful technique for specific tasks such as this one.  In fact, I wrote that post so I could link to it in this post.

However, even if IFI is turned on, it’s only going to work for data files that aren’t encrypted with TDE.  Logs and TDE data files need the zeros.  Also, if any database on your instance is using TDE then so is TempDB, which means its data files can’t use IFI either.

CREATE TABLE #Output
(
	DataOut VarChar(2000)
)

DECLARE @XP_CmdShell_Enabled int

SELECT @XP_CmdShell_Enabled = CONVERT(INT, ISNULL(value, value_in_use))
FROM master.sys.configurations
WHERE name = 'xp_cmdshell'

IF @XP_CmdShell_Enabled = 0 BEGIN
	EXEC sp_configure 'show advanced options', 1
	RECONFIGURE WITH OVERRIDE 
	EXEC sp_configure 'xp_cmdshell', 1
	RECONFIGURE WITH OVERRIDE 
END 

INSERT INTO #Output 
EXEC xp_cmdshell 'whoami /priv'

IF @XP_CmdShell_Enabled = 0 BEGIN
	EXEC sp_configure 'xp_cmdshell', 0
	RECONFIGURE WITH OVERRIDE 
END 

SELECT IFI_Enabled = COUNT(1) 
FROM #Output 
WHERE DataOut LIKE '%SeManageVolumePrivilege%Enabled%'

DROP TABLE #Output

If IFI is turned off and it’s proper to turn it on for this server, here are your steps to turn it on:

  1. Open Administrative Tools / Local Security Policy
  2. Local Policies
  3. User Rights Assignment
  4. Open “Perform volume maintenance tasks”
  5. Add the user for the SQL Server service account

If IFI can’t be used, here are your steps (which are also good even if IFI is being used):

  1. Monitor database sizes for manual growths
  2. Grow files manually

The SQL Server service account, if you don’t know which account it is, can be found in Administrative Tools / Services / SQL Server (InstanceName) under “Log On As”.  There are easier ways find the service account name in bulk if you’re doing this a lot, such as a slight variation of the query above.

xp_cmdshell Rant

Now, to be clear on xp_cmdshell which I used in the script above…. I do believe in security, but I don’t believe disabling this feature is the security you’re looking for.  When it’s set up properly, disabling xp_cmdshell is like locking the door to your data center’s supply closet with a keyless lock instead of limiting access to the data center.

I do have issue with granting execute permissions on this to non-sysadmin accounts.  I also have issue with granting sysadmin to anyone who asks, including vendors who insist that’s the only way their app will work.  This means the only users that can use it are the very, very few with sysadmin.  Also, any sysadmin can turn it on anyways, so the only extra security you get is a message in the error log saying it was turned on, but not even who did it.

My recommendation is that if you need it, leave it on.  If you don’t, leave it off.  If you have a one-time script that needs it, such as checking for IFI, turn it on just long enough to do what you need to do then automate turning it off.  The script follows this recommendation; it’s left on if it was already on, but turns it off if it was off.

It’s time for me to admit I’m going off on a tangent, so I’ll pass you off to Sean McCown’s (b|tSecurity Theater post if you’re too fired up to stop now.

In Summary

Autogrowth – Yes.  Just as a fail-safe if performance is important to you.  Limit the size to limit the performance impact, but don’t cause undue fragmentation.

Manual Growth – Yes.  Trend how fast you’re growing so you know how to stay ahead of it.

Instant File Initialization – Usually.  Understand the limitations and security risks, and turn it on if it’s the right thing to do.

Entry-Level Content Challenge

This is my fourth post in Tim Ford’s Entry Level Content Challenge.  I went through much of my career with people saying to manually grow files, but it was left at that.  I had no clue how to see how much space was used without clicking through the GUI, and passed it off as being ridiculous.  Now I found ways to make it easy, and I’m betting there’s a lot of people out there doing too much work or skipping this simply for not knowing how.

Read over Tim’s challenge and consider joining in.  It’s a great way to help people get past barriers you had in the past while learning how to clear them a little more efficiently yourself.  Anyone who’s reading this post already knows how to clear some barriers that others are viewing as an impassible brick wall, so you can make a difference for them.


Advertisement

Database Growth Trends – Idera Diagnostic Manager

How fast are your databases growing?  Should I panic about a 1 TB database that has 100 GB free on disk?  Am I safe with a 100 GB database that also has 100 GB free?  Based on those sizes…I have no idea.

It’s possible that the 1 TB database is purging data as fast as it takes it in, so it’s been at 1 TB for a long time and may never use the 100 GB it has free.  Looking at the 100 GB database, it may have been a new 1 MB database created two months ago and grew 1 MB at a time to get to where it’s at now. (Bonus points if you panicked reading that last sentence.)

The thing to look for is how big that database was before.  What did you write down for how much space it used last week, last month, and several months ago?  Do you remember all those stock broker commercials saying “Past performance doesn’t predict future results” which is supposed to lead you on to think “Yeah, but it’s the best indicator I have.”  The same goes for database growths.  So, you did write down what it was before, right?

My Default Monitoring Message

I’ll copy/paste this section on multiple posts, so feel free to skip it if you’ve seen it before.

The biggest issue is the word “before”.  If you weren’t watching your servers before then you have nothing to compare the current state of your server to.  Also, if you’re watching it consistently then you’ll be able to make an apples to apples comparison.

Your production servers should have some kind of monitoring software in place, and the monitoring software is already capturing this type of information to help make all the pretty charts and graphs you see through the GUI.  You need this software to run so you can get alerted when things go wrong, and pulling this data will just make it more valuable.

Monitoring software doesn’t perform magic, so you can pull this data on your own if you don’t have any.  However, that’s taking on a lot of responsibility, time, and effort.  If something is collecting the data already, take advantage of that.

For me, I use Idera Diagnostic Manager, so my queries are going to look at the data collected using this tool.  Other monitoring tools are going to collect the same basic data in a database you can read.

If anyone from one of these companies wants to provide me with scripts that fill the same need, I’ll make a write up on them and give you credit for being awesome supporting your product like that.  I can only write against what I can test against, it’s nothing personal.

What I’m Watching

I want to know when my files will hit an autogrowth and when they’ll run out of space.

Running out of space is pretty obvious.  If you’re out of space, every command that needs more space will fail, and users will run to the supply closet for torches and pitchforks.  It’s a bad day for the DBA.

Autogrowth is less of an issue and less obvious.  That’s not saying it’s not an issues, especially for larger databases that can’t take advantage of IFI.  The command that needs more space, and any that pile up behind it, will wait patiently (barring any timeouts) for the growth to take place.  However, SQL Server can be more patient than your users or applications.

That being said, if I knew I’d need more space than is allocated in the database using a simple script then I could do it when no one was waiting for the space.  No complaints, just make the files larger and move on with my life.  Oh, happy days.

To get all of this information I need to know a couple things:

  • How much space is used in each filegroup
  • How much space is allocated to each filegroup
  • How much can each filegroup grow according to disk free space and growth rates

Idera DM Captures That

Well, Idera does a pretty good job.  It captures the data size (used), data expansion (growth by growth rate and disk free space), and data file size (allocated).  The problem is that it captures this stuff on the database level, not the filegroup level.  This means that it’s possible for a filegroup to run out of space while the database as a whole has tons of free space.

I’m currently working in an environment where all data files for a single database are on the same drive, so it’s less concerning to me.  It is something to keep in mind, and may be very important to your environment.  If this is critical to you, I touch on how to capture this data yourself below.

If separating filegroups isn’t an issue for you (it often isn’t) then all you have to do to trend growths with Idera is to write a very long script that hits SQLdmRepository..DatabaseSize a couple times.  My script goes a little like this:

/*
MaxUsed is always from a week long range.  The reason is that this captures any spikes in usage such as off-hours index maintenance.
*/

;WITH MostRecent AS
(
	SELECT X.DatabaseID
		, X.UTCCollectionDateTime
		, S.InstanceName
		, D.DatabaseName
		, DataFileSizeMB = DataFileSizeInKilobytes/1024
		, DataFilePotentialSizeMB = (X.DataFileSizeInKilobytes + X.DataExpansionInKilobytes)/1024
	FROM (
			SELECT DS.DatabaseID
				, RowNum = DENSE_RANK() OVER (PARTITION BY DS.DatabaseID ORDER BY UTCCollectionDateTime DESC)
				, UTCCollectionDateTime
				, DataFileSizeInKilobytes
				, DataExpansionInKilobytes
			FROM SQLdmRepository..DatabaseSize DS
			WHERE UTCCollectionDateTime > GETUTCDATE()-7 
		) X
		INNER JOIN SQLdmrepository..SQLServerDatabaseNames D ON X.DatabaseID = D.DatabaseID
		INNER JOIN SQLdmrepository..MonitoredSQLServers S ON S.SQLServerID = D.SQLServerID 
	WHERE RowNum = 1
)
, ThisWeek AS
(
	SELECT DS.DatabaseID
		, MaxUsedMB = Max(DataSizeInKilobytes + TextSizeInKilobytes + IndexSizeInKilobytes)/1024
	FROM SQLdmRepository..DatabaseSize DS
	WHERE UTCCollectionDateTime > GETUTCDATE()-7 
	GROUP BY DS.DatabaseID 
)
, OneMonth AS
(
	SELECT DS.DatabaseID
		, MaxUsedMB = Max(DataSizeInKilobytes + TextSizeInKilobytes + IndexSizeInKilobytes)/1024
	FROM SQLdmRepository..DatabaseSize DS
	WHERE UTCCollectionDateTime BETWEEN GETUTCDATE()-37 AND GETUTCDATE()-30 
	GROUP BY DS.DatabaseID 
)
, ThreeMonth AS
(
	SELECT DS.DatabaseID
		, MaxUsedMB = Max(DataSizeInKilobytes + TextSizeInKilobytes + IndexSizeInKilobytes)/1024
	FROM SQLdmRepository..DatabaseSize DS
	WHERE UTCCollectionDateTime BETWEEN GETUTCDATE()-97 AND GETUTCDATE()-90 
	GROUP BY DS.DatabaseID 
)
, SixMonth AS
(
	SELECT DS.DatabaseID
		, MaxUsedMB = Max(DataSizeInKilobytes + TextSizeInKilobytes + IndexSizeInKilobytes)/1024
	FROM SQLdmRepository..DatabaseSize DS
	WHERE UTCCollectionDateTime BETWEEN GETUTCDATE()-187 AND GETUTCDATE()-180 
	GROUP BY DS.DatabaseID 
)
, OneYear AS
(
	SELECT DS.DatabaseID
		, MaxUsedMB = Max(DataSizeInKilobytes + TextSizeInKilobytes + IndexSizeInKilobytes)/1024
	FROM SQLdmRepository..DatabaseSize DS
	WHERE UTCCollectionDateTime BETWEEN GETUTCDATE()-365 AND GETUTCDATE()-358 
	GROUP BY DS.DatabaseID 
)
, PreResults AS 
(
	SELECT MR.InstanceName
		, MR.DatabaseName 
		, MR.DataFileSizeMB
		, ThisWeek_MaxUsedMB = CAST(W.MaxUsedMB AS INT)
		, OneMonth_MaxUsedMB = CAST(M1.MaxUsedMB AS INT)
		, ThreeMonth_MaxUsedMB = CAST(M3.MaxUsedMB AS INT)
		, SixMonth_MaxUsedMB = CAST(M6.MaxUsedMB AS INT)
		, OneYear_MaxUsedMB = CAST(M12.MaxUsedMB AS INT)
		, NextGrowthInDays_OneMonth = CAST((MR.DataFileSizeMB-W.MaxUsedMB)/(W.MaxUsedMB - M1.MaxUsedMB + .0001)*30 AS BIGINT)
		, NextGrowthInDays_ThreeMonth = CAST((MR.DataFileSizeMB-W.MaxUsedMB)/(W.MaxUsedMB - M3.MaxUsedMB + .0001)*90 AS BIGINT)  
		, NextGrowthInDays_SixMonth = CAST((MR.DataFileSizeMB-W.MaxUsedMB)/(W.MaxUsedMB - M6.MaxUsedMB + .0001)*180 AS BIGINT)  
		, NextGrowthInDays_OneYear = CAST((MR.DataFileSizeMB-W.MaxUsedMB)/(W.MaxUsedMB - M12.MaxUsedMB + .0001)*360 AS BIGINT)  
		, OutOfSpaceInDays_OneMonth = CAST((MR.DataFilePotentialSizeMB-W.MaxUsedMB)/(W.MaxUsedMB - M1.MaxUsedMB + .0001)*30 AS BIGINT)  
		, OutOfSpaceInDays_ThreeMonth = CAST((MR.DataFilePotentialSizeMB-W.MaxUsedMB)/(W.MaxUsedMB - M3.MaxUsedMB + .0001)*90 AS BIGINT)  
		, OutOfSpaceInDays_SixMonth = CAST((MR.DataFilePotentialSizeMB-W.MaxUsedMB)/(W.MaxUsedMB - M6.MaxUsedMB + .0001)*180 AS BIGINT)  
		, OutOfSpaceInDays_OneYear = CAST((MR.DataFilePotentialSizeMB-W.MaxUsedMB)/(W.MaxUsedMB - M12.MaxUsedMB + .0001)*360 AS BIGINT) 
	FROM MostRecent MR
		INNER JOIN ThisWeek W ON MR.DatabaseID = W.DatabaseID
		LEFT JOIN OneMonth M1 ON MR.DatabaseID = M1.DatabaseID AND W.MaxUsedMB > M1.MaxUsedMB
		LEFT JOIN ThreeMonth M3 ON MR.DatabaseID = M3.DatabaseID AND W.MaxUsedMB > M3.MaxUsedMB
		LEFT JOIN SixMonth M6 ON MR.DatabaseID = M6.DatabaseID AND W.MaxUsedMB > M6.MaxUsedMB
		LEFT JOIN OneYear M12 ON MR.DatabaseID = M12.DatabaseID AND W.MaxUsedMB > M12.MaxUsedMB
)
SELECT InstanceName
	, DatabaseName 
	, NextGrowthInDays_Min = CASE WHEN NextGrowthInDays_OneMonth <= ISNULL(NextGrowthInDays_ThreeMonth , 1000000)
										AND NextGrowthInDays_OneMonth <= ISNULL(NextGrowthInDays_SixMonth, 1000000) 
										AND NextGrowthInDays_OneMonth <= ISNULL(NextGrowthInDays_OneYear, 1000000)
									THEN NextGrowthInDays_OneMonth 
								WHEN NextGrowthInDays_ThreeMonth <= ISNULL(NextGrowthInDays_SixMonth, 1000000)
										AND NextGrowthInDays_ThreeMonth <= ISNULL(NextGrowthInDays_OneYear, 1000000)
									THEN NextGrowthInDays_ThreeMonth
								WHEN NextGrowthInDays_SixMonth <= ISNULL(NextGrowthInDays_OneYear, 1000000)
									THEN NextGrowthInDays_SixMonth
								ELSE NextGrowthInDays_OneYear
							END
	, OutOfSpaceInDays_Min = CASE WHEN OutOfSpaceInDays_OneMonth <= ISNULL(OutOfSpaceInDays_ThreeMonth, 1000000)
										AND OutOfSpaceInDays_OneMonth <= ISNULL(OutOfSpaceInDays_SixMonth, 1000000)
										AND OutOfSpaceInDays_OneMonth <= ISNULL(OutOfSpaceInDays_OneYear, 1000000)
									THEN OutOfSpaceInDays_OneMonth 
								WHEN OutOfSpaceInDays_ThreeMonth <= ISNULL(OutOfSpaceInDays_SixMonth, 1000000)
										AND OutOfSpaceInDays_ThreeMonth <= ISNULL(OutOfSpaceInDays_OneYear, 1000000)
									THEN OutOfSpaceInDays_ThreeMonth
								WHEN OutOfSpaceInDays_SixMonth <= ISNULL(OutOfSpaceInDays_OneYear, 1000000)
									THEN OutOfSpaceInDays_SixMonth
								ELSE OutOfSpaceInDays_OneYear
							END
	, DataFileSizeMB
	, ThisWeek_MaxUsedMB
	, OneMonth_MaxUsedMB 
	, ThreeMonth_MaxUsedMB 
	, SixMonth_MaxUsedMB
	, OneYear_MaxUsedMB
	, NextGrowthInDays_OneMonth 
	, NextGrowthInDays_ThreeMonth 
	, NextGrowthInDays_SixMonth 
	, NextGrowthInDays_OneYear 
	, OutOfSpaceInDays_OneMonth
	, OutOfSpaceInDays_ThreeMonth
	, OutOfSpaceInDays_SixMonth
	, OutOfSpaceInDays_OneYear 
FROM PreResults
WHERE OutOfSpaceInDays_OneMonth < 100
	OR OutOfSpaceInDays_ThreeMonth < 100
	OR OutOfSpaceInDays_SixMonth < 100
	OR OutOfSpaceInDays_OneYear < 100
	OR NextGrowthInDays_OneMonth < 15
	OR NextGrowthInDays_ThreeMonth < 15
	OR NextGrowthInDays_SixMonth < 15
	OR NextGrowthInDays_OneYear < 15
ORDER BY DataFileSizeMB DESC

What this does is look at the trends based on what the database used 30, 90, 180, and 360 days ago to try to predict the future.  By “predict the future” I mean it’s not perfect, and can’t be perfect.  However, it gives you very good data with a few false positives and very few false negatives.

Speaking of this not being perfect, it double-dips.  If there are two databases growing on the same drive with 10 GB free, it says that each one has 10 GB of growth available.  I was not able to rewrite this to take that into account while also accounting for databases with multiple files in a single filegroup spread across multiple drives.

Now I’m two weeks ahead of projected file growths and over three months ahead of projected out-of-space errors.

This is very basic information, and I’d have trouble imagining any SQL monitoring software not capturing this in a table you can query.

If I Didn’t Have Idera…

If I didn’t have Idera, or any other monitoring software I could query, I’d be going out at least once a day and pulling the allocated and used space from every file on every server.  I may want to do it more often to find peak usage, such as when online index rebuilds are using twice their typical space over the weekends; I take advantage of Idera capturing this hourly.  I’ll capture it using something like this:

SELECT @SQL = 
'USE [?]

INSERT INTO DBA..FileSizes (DateAdded, Database_ID, File_ID, Data_Space_ID, SizeMB, UsedMB)
	select GETDATE() 
		, Database_ID = DB_ID()
		, f.File_ID
		, f.data_space_id
		, SizeMB = ((f.size*8/1024)) 
		, UsedMB = (FileProperty(f.name, ''SpaceUsed'')*8/1024) 
	from sys.database_files f
	'

exec sp_MSforeachdb @SQL

Then I’d need to see how much free space I have on each drive, so I’d go to Ed Wagner’s article Time and Space: How to Monitor Drive Space in SQL Server.  Knowing that we use MountPoints in places, I’d have to change his script to use “volume” instead of “logicaldisk” (also mentioned in his comments).  This minor change is about the best case scenario you’ll run across.

Remember, the scripts you find on the internet are typically designed to work perfect on the AUTHOR’s system, not yours.  It’s not Ed’s fault they don’t use MountPoints, in fact he should probably be congratulated for not making his environment more complex than it needs to be.  He should also be congratulated on not making a change to his article that he can’t properly test.  At least you know you have to be extra careful testing this change instead of being led to believe the author did something they couldn’t do properly.

After getting the drive’s free space, I’d have to look at the file growth rates to see how large my files could grow.  Keep in mind that growth in sys.database_files could be either a percentage or the number of 8kb pages the file will grow by, depending on the value in is_percent_growth.  Static growths are easy, just divide by 128 and that’s how many MBs it will grow by.  It’s easier (and better for your server) to change percentage growths to MB than it is to look up the logarithmic functions used to calculate compound interest that also apply here.

Now that you have the free space on the drive and the growth rates on the files, you can calculate the maximum size the file can grow to.  Use this with trends on the used space to calculate when that size won’t be enough for you.

Make sure you test your results, you’ll have to support it.

So Your Database Is Growing…

Databases get larger, it’s what they do.  A normal DBA then goes through and makes sure that there’s room for that growth.  A better DBA will do that, too, but then follow it up by figuring out why the database is growing and try to justify it.

I have seen way too many databases out there that don’t purge old data that’s useless to the company.  Sometimes the purge was never written, sometimes the code to do that is never being called for several somewhat humorous reasons.  Any way you look at it, the data is growing and it’s easy to fall into the trap of just adding space every month, forever.

The way I handle this is by watching my tables and seeing how they’re growing.  These are treated just like databases where the largest one isn’t necessarily the growth issue, and looking at historical data to see the growth trend is a better solution.

In the past I wrote a post called Monitoring Database and Table Sizes to get this info yourself.  In the future, I’ll write Table Growth Trends – Idera Diagnostic Manager.  At the time of this writing, I’m planning on the Table Growth post coming out three weeks after this one.  Until then, I put this script up on my Idera Diagnostic Manager Scripts page, which is where I keep these posts organized and where I put my scripts to wait for me to blog about them.


Shrinking Database Log Files

Files in SQL Server need to grow as the database grows, and in very specific circumstances need to be shrunk as well with additional maintenance.  There is quite a bit different between log files and data files, so I created a separate post for Shrinking Database Data Files.

When should you shrink log files

First, if a large process that will never happen again caused your log file to grow to a ridiculous size then it’s reasonable to shrink the file down to about 150% of the most space you expect to use in the next year.  Cleaning this up will also cut down on restore times.

Second, if your log file grew in small increments then you’re left with a large number of VLFs like I talked about in file growths.  The only way to get rid of these is to shrink your log files down then have them grow in larger increments.  When I do this, I’m also growing them manually immediately afterwards in the same script.

What happens when you shrink log files

The log file will find a group of empty VLFs and delete them.  The end, your file is shrunk.

Of course there’s a little more to it than that.  The parts I’m most worried about are why did you need that space in the first place, why do you need the space freed up, and what happens when you need it again?

To understand why you needed it we need to talk about what a log file really is for a second.  It is every change made to your database since the last point-in-time where it didn’t need all the changes saved off.  This is typically either the oldest open transaction (so it can roll back any change if the transaction fails) or, if your database is in full or bulk-logged recovery, the last time you ran a log backup   It can also be due to other functionality such as database mirroring, but you typically have an experienced DBA on hand for that.

Why is this common to do?

There is typically at least once in every large database’s life where the log needs to be shrunk for one of a couple reasons.

Going off of the two reasons above, the first two are because a large process ran that won’t run again.  The third reason I go over here is because of small VLFs.

1. Log backups weren’t set up

The first large process is when a database is set up in full or bulk-logged recovery, but the log backups weren’t set up until the drive filled.  This is because the log needs to be backed up before it can be flushed, which means it will grow until it runs out of space.  It’s common to miss this when the backup plan needs you to specify which databases to back up, as opposed to doing all databases.  Once you take the first log backup it leaves you with a huge log file where you don’t expect to hit that size again, and it’s ok to shrink it.

2. Runaway transaction

The second large process is when someone runs something that didn’t go as planned.  A transaction, even an implied transaction for a single statement, stayed open forever, or close enough to forever to cause us a headache.  This caused a ton of excessive growth in the log files, and that space will only ever be used when someone says “oops” again.  In this case, evaluate if you’ll need that space for another process before you shrink because someone will say “oops” again someday.  If the drive is dedicated to log files and you only have one large database, consider shrinking it just enough to clear the warnings in your monitoring software.

3. VLF cleanup

The final reason is because you have too many VLFs.  When a log file is created or grows it splits up the new space into smaller chunks called Virtual Log Files that SQL Server will cycle through when writing logs.  If the database is growing in small increments it creates tons of these, slowing SQL Server down.  The point here is that you resolve the issue by shrinking the log (delete smaller VLFs), then grow the log to the desired size in larger chunks (create bigger VLFs).  The details on finding what size your VLFs are, what size new VLFs will be, and just about everything else VLF related is in my post Database Log VLFs.

What happens when log files grow?

If you’re going to shrink a log file then you’re increasing the chances that it will have to grow again, so we need to talk about growth for a second.

When a data file grows it can often take advantage of instant file initialization where it just reserves unallocated space on the disk, making it a quick process.  Without this being turned on or if you’re using Transparent Data Encryption, SQL Server would have to zero out the disks to get rid of data that used to be there.  Kimberly Tripp (b|t) goes into a lot more details than this in her post Instant Initializations – What, Why and How?.

Log files can’t use this feature.  They write those 0’s every time the log grows, and SQL Server is patient enough to wait for that to happen.  Here’s how that went over the last time I overheard one of my users “discussing” this with my biggest server.

SQL Server: My log’s full, hold on while I get some more space.

User: I don’t care, I just want my query to finish.

SQL Server: I’m told to grab 8,000 MB at a time, please be patient.

User: Not a problem, there’s 8,000 MB right there, please hurry.

SQL Server: I only use clean space, hold on while I ask the OS to write about 8,388,608,000 zeroes for me.  This isn’t a problem, I’m patient.

User: What?  NO!  Well, at least that gives me enough time to open a ticket for the DBA.

Ticketing System: Hello again, I haven’t seen you for several minutes.

The moral of this story is that you don’t want autogrowth to happen.  You want it turned on for emergencies and one-time growths, but it’s better to grow manually in a maintenance window.  Here’s how that maintenance window conversation goes:

DBA: I see you’ve hit 90% utilization on your log a couple times, how about we add 8,000 MB.

SQL Server: Oh, I didn’t notice, but I can add that space now.  I only use clean space, hold on while I ask the OS to write about 8,388,608,000 zeroes for me.  This isn’t a problem, I’m patient.

User: Zzzzzzzz….

DBA: There’s no rush, everyone can use the existing log space while you work on that.

Ticketing System: Zzzzzzz…..

The 8,000 MB I used here isn’t a made-up number, it’s a best practice due to VLF sizes on larger databases.  Most DBAs set autogrowth to less than 8,000 because they’d rather deal with smaller VLFs than irate users, and I’d recommend 1,000 MB for autogrowth on larger databases.  To be fair, that number drops to 500 MB starting in SQL 2012, but that’s still a lot of waiting during peak hours.

On smaller databases you aren’t going to want to grow log files by 8,000 MB off hours, or even 1,000 MB for autogrowth.  The growth should be something rather significant for the database yet size appropriate, and I typically like to do close to 50% of the current file size.  So, if I have a 500 MB log, I’ll set it to 250 MB autogrowth and do manual growths of the same size.  For smaller databases where 50% log growth would be less than 100 MB, I’m not always worried about manually growing the log files since there are diminishing returns on my time and effort.

My post Database Log VLFs gets into the details of why those are best practices and what it means to you.

Entry-Level Posts

Tim Ford (b|t) noticed how we moved to advanced topics and asked us to remember where we came from in his Entry-Level Content Challenge.  This is my second post to take on his challenge, and I hope others will take him up on this!


Database Log VLFs

Virtual Log Files (VLFs) split a physical database log file into smaller segments, which are required for how log files work in the background.  These are created automatically, but automatically doesn’t always mean perfect.  Here’s a practical view of what you need to know and how you can set them up properly.

What VLFs Do

My initial view of how a transaction log worked was that each change was written to a log file, and, as the documentation of those changes was no longer required, it was deleted from the log file.  I think this is a common way to view it, and it’s close to the truth.  However, it’s not close enough for a conversation on VLFs.

What really happens is that changes are written to the first VLF, which is just a segment of the log file.  When that VLF fills up, it moves on to the next VLF in a systematic order.

Each change made to the database is assigned a Log Sequence Number (LSN), and SQL Server keeps track of the oldest LSN it still needs for any purpose.  This purpose can be many things, but is typically the oldest LSN of the following:

  • Oldest LSN on a log backup (full or bulk-logged recovery)
  • LSN at the start of the oldest active transaction
  • LSN last replicated when using certain types of replication

Here’s my extremely complicated script to tell you what that reason is for your database:

SELECT name
	, log_reuse_wait_desc 
FROM sys.databases

If the last LSN in a VLF is older than what you need to keep, that VLF can be reused.  This makes is very efficient because this becomes something like a set-based operation for SQL Server, the entire VLF is cleared and marked for reuse at once instead of line-by-line.

To help you picture how the VLFs work, someone at Microsoft drew you a picture on Transaction Log Physical Architecture.  Then you can look at the results of DBCC LogInfo, and it will make a lot more sense when you see a VLF on each line there along with its status.

Only One Log File, Dedicated Drive

Adding more than one log file on a single database isn’t going to help your performance.  SQL Server is writing to a single VLF at a time, and that single VLF is part of a single log file.  If you have multiple log files then you’re writing to one while the other sits idle.  Once you fill up the last VLF on the first file it starts writing to the second file while the first sits idle.  If these are on separate drives that means each drive has to be able to handle the I/O, but it’s hit or miss if you’re using the I/O which leads to wasted resources and inconsistent performance.

As for how you’re writing to the log, most of the work done is writing to the tail end of it so spinning disks do really well just keeping the head in one place and writing to the file.  That is unless you have other types of files on this disk so the head writes a little to the log, jumps over to write a little to a data file, writes a bit more to the log, then jumps over to read a couple indexes.  This is a lot of where the recommendation to keep your data and log files on separate disks come from, but there is more to it than I’ll get into here.

However, we’re going to use RAID for redundancy making the drives too large for just a log, then we’ll put it on a SAN with a write cache, and do so many other things to make it more complicated.  If a server is extremely stressed and highly critical, look into dedicated spindles, SSDs, or other options.  On general shared disk arrays, it’s nice if you can have an array dedicated to just log files, even if it’s log files for multiple servers.

VLF Size Matters

When you’re writing to VLFs there can be two issues.  First, the VLFs are very small and SQL Server is jumping all over the place maintaining small files and figuring out where it should write the next entry – this is common and a big performance hit.  Second, the VLFs are too large and SQL Server is reserving a ton of space when only a small part of the tail end of the VLF is in use, then trying to clear it all at once – this is less common and less of an issue.

In addition to this, VLFs each need to be processed when restoring or recovering a database.  Recovering is part of restarting SQL services, so you should be hitting this issue at least once a month with your Windows Updates.  Every VLF adds some overhead to this process, and a huge number adds a lot of overhead to lengthen this process.

Details of this are on the Microsoft Customer Service and Support blog post How a log file structure can affect database recovery time, and it includes this eye-opening quote, “The first phase of recovering a database is called discovery where all the VLFs are scanned (in serial and single threaded fashion) before actual recovery starts.”

Are your log files pre-sized to take up the entire drive even though they only ever use 5% of that space?  Is that hurting you on recovery?

How Big Are My VLFs?

I have a script for that.  This is set to filter only logs that I want to look at, but you can comment out there WHERE clause on the final statement to see it all.  Also, it would be extremely rare for me to look at individual VLFs, so this is only looking at the sums and averages for each file.

I used to manually comment out a line on this depending on the version of SQL Server until I read a post on VLFs by Andy Galbraith (b|t) Counting Your VLFs, or, Temp Tables Inside IF…ELSE Blocks.  Thank you, Andy.  The timing of your post was perfect to help me make this easier for everyone.

CREATE TABLE #VLF_temp 
(
	RecoveryUnitID int
	, FileID varchar(3) 
	, FileSize numeric(20,0)
	, StartOffset bigint 
	, FSeqNo bigint 
	, Status char(1)
	, Parity varchar(4) 
	, CreateLSN numeric(25,0)
)

CREATE TABLE #VLF_db_total_temp
(
	DatabaseName sysname 
	, LogiFilename sysname
	, PhysFileName sysname
	, AVG_VLF_Size_MB DECIMAL(12,2)
	, vlf_count int
	, log_size_mb FLOAT
	, log_growth_mb FLOAT
)

IF (SELECT LEFT(cast(serverproperty('ProductVersion') as varchar),2)) in ('8.','9.','10') BEGIN
	ALTER TABLE #VLF_temp DROP COLUMN RecoveryUnitID
END

DECLARE db_cursor CURSOR READ_ONLY FOR 
SELECT name FROM sys.databases
WHERE State = 0

DECLARE @name sysname, @stmt varchar(40)

OPEN db_cursor

FETCH NEXT FROM db_cursor INTO @name

WHILE (@@fetch_status <> -1) BEGIN
	IF (@@fetch_status <> -2) BEGIN
		INSERT INTO #VLF_temp
		EXEC ('DBCC LOGINFO ([' + @name + ']) WITH NO_INFOMSGS')

		INSERT INTO #VLF_db_total_temp (DatabaseName, LogiFilename, PhysFileName, vlf_count, AVG_VLF_Size_MB, log_size_mb, log_growth_mb)
		SELECT DatabaseName = @name
			, LogiFilename = mf.name
			, PhysFileName = mf.physical_name
			, vlf_count = COUNT(*)
			, AVG_VLF_Size_MB = (AVG(FileSize)/1024)/1024
			, log_size_mb = (mf.size * 8)/1024 
			, log_growth_mb = CASE mf.is_percent_growth
									WHEN 1 THEN (mf.size * 8)/1024 * mf.growth/100
									WHEN 0 THEN  (mf.growth * 8)/1024 
									END
		FROM #VLF_temp vt
			INNER JOIN sys.master_files mf ON mf.database_id = db_id(@name) AND mf.file_id = vt.fileid
		GROUP BY mf.name, mf.physical_name,mf.size,mf.growth,mf.is_percent_growth;           

		TRUNCATE TABLE #VLF_temp           
	END

	FETCH NEXT FROM db_cursor INTO @name
END

CLOSE db_cursor
DEALLOCATE db_cursor

SELECT * 
	, USEDB = 'USE [' + DatabaseName + ']' 
	, CP = 'CHECKPOINT'
	, ShrinkZero = 'DBCC SHRINKFILE (N''' + LogiFileName + ''' , 0)'
	, GrowBack = 'ALTER DATABASE [' + DatabaseName + '] MODIFY FILE ( NAME = N''' + LogiFileName + ''', SIZE = ' + CAST(log_size_mb AS VARCHAR(20)) + 'MB ) --I split this up when over 10,000 MB'
	, ChangeGrowth = CASE --Note, never gets up to the 8000 MB I recommend for manual growths, but still 250 MB VLFs
						WHEN DatabaseName = 'tempdb' THEN ''
						WHEN log_size_mb <= 128 THEN 'ALTER DATABASE [' + DatabaseName + '] MODIFY FILE ( NAME = N''' + LogiFileName + ''', FILEGROWTH = 32MB )'
						WHEN log_size_mb <= 512 THEN 'ALTER DATABASE [' + DatabaseName + '] MODIFY FILE ( NAME = N''' + LogiFileName + ''', FILEGROWTH = 128MB )'
						WHEN log_size_mb <= 4000 THEN 'ALTER DATABASE [' + DatabaseName + '] MODIFY FILE ( NAME = N''' + LogiFileName + ''', FILEGROWTH = 1000MB )'
						WHEN log_size_mb <= 16000 THEN 'ALTER DATABASE [' + DatabaseName + '] MODIFY FILE ( NAME = N''' + LogiFileName + ''', FILEGROWTH = 1000MB )'
						ELSE 'ALTER DATABASE [' + DatabaseName + '] MODIFY FILE ( NAME = N''' + LogiFileName + ''', FILEGROWTH = 1000MB )'
						END
FROM #VLF_db_total_temp
WHERE (vlf_count > 50 
		AND Avg_VLF_Size_MB < vlf_count / 3) 
	OR (vlf_count > 250
		AND AVG_VLF_Size_MB < vlf_count / 2)
ORDER BY vlf_count DESC 

DROP TABLE #VLF_temp 
DROP TABLE #VLF_db_total_temp

What’s the Right Size?

The most common thing you’ll see on the internet is people talking about having too many with the limit being 1,000 VLFs and ideally at 50 VLFs.  I’m a little different and focus more on size than number.  The concept I’m going for is that excessive context switching is what causes me grief, and a reasonable size VLF will keep that under control.

Now there’s no magic number that will work noticeably better in all cases, so I won’t give you static numbers and say they’re magic.  What I can say is that too small is basically fragmentation with the overhead of context switching, too many increases recovery time, too big is huge chucks, and too few could cause extra growths as unused space is still being reserved.

It’s easy to visualize how smaller and excessive numbers of VLFs can cause issues, but that doesn’t mean huge VLFs are the way to go.  Tammy Richter Jones (b) gets into details with her post If > 50 VLFs are bad, then 16 is good, right?.  I’d love to see more on the affects of huge VLFs to have a more complete understanding if a 1 TB log file is better off with 50 20GB VLFs or 2,000 500MB VLFs.  I’m not convinced that >50 is bad.

Personally, I like formulas a lot more than static numbers, especially since they allow me to avoid extremes without stressing out.  The formulas I used broke it down into three categories:

  1. Below 50 VLFs, this is a reasonable number, they get a free ride no matter how big they are.
  2. Between 50 and 250 VLFs, the average size in MB has to be at least 1/3 of the count of VLFs.
    • For a file with 100 VLFs, the average VLF has to be over 33 MB.
  3. Over 250 VLFs, the average size in MB has to be at least 1/2 of the count of VLFs.
    • For a file with 500 VLFs, the average VLF has to be over 250 MB.

This is good enough for almost any database.  I don’t care about there being a couple small VLFs mixed in there because I’ll spend most of my time in the large ones.  I don’t care about the numbers getting larger because the average VLF is large enough to avoid too much context switching.  You’re not out to micromanage, so take a relaxed approach to this unless you have a reason to not be relaxed.

What’s Default?

Remember how I said there were no magic numbers?  Well, that doesn’t mean there aren’t wrong numbers.

By default, every database is based off of model, which has a 1 MB log files growing in 10% increments.  So 1/10th of a MB for the first growth, which is just a tiny fragment.  If you leave it this way on large databases you could end up with a 1 TB log trying to grow 100 GB at a time, which your users will notice.

Be default, you get the worst of both worlds!  The goal here is to avoid extremes, so you’ll want to change the growth rates away from the default.

How Do I Change the Size?

There’s only one way to change the size of your VLFs.  Delete them and recreate them.

For every database EXCEPT TempDB, this means shrinking the logs (it deletes VLFs to get to the size you want), then growing the logs again.  Both manual and automatic growths will split the new physical space into VLFs, but that depends on your version of SQL Server.

Here are the growth rates I pulled from Paul Randal’s post Important change to VLF creation algorithm in SQL Server 2014.

SQL 2012 and earlier uses this formula:

<= 64 MB growth is 4 VLFs

64 MB and <= 1 GB = 8 VLFs

1 GB = 16 VLFs

SQL 2014+ uses this formula:

Is the growth size less than 1/8 the size of the current log size?

Yes: create 1 new VLF equal to the growth size

No: use the formula above

So if you have too many VLFs you can shrink your log file.  It will delete VLFs that are not in use to make it smaller.  Then grow the file in increments that give you VLFs sized how you want them.  If you’re going for 500 MB VLFs then you grow your file 8,000 MB at a time.

The VLFs that weren’t deleted in this process, because they were in use or you didn’t shrink the file as far as you could have, will not be affected.  This means you’ll have different sized VLFs throughout your file, but that doesn’t really matter.  What does matter is that you don’t have any ridiculously large VLFs and you’re spending most of your time in properly sized VLFs.

Here’s how I do it.  Shrink it as much as possible.  Shrinking is never as easy as it should be, so verify it shrunk it a significant amount.  If it didn’t, take log backups and try again, repeating this process a handful of times if needed.  Then, if I want the log to be 32,000 MB, I just grow it by 8,000 MB 4 times.

--Run a log backup before this if database is not in simple and log backups run less frequently than every 5 minutes.
USE [DatabaseName]
GO
CHECKPOINT
GO
DBCC SHRINKFILE (N'LogicalFileName_Log' , 0)
GO
USE [master]
GO
ALTER DATABASE [DatabaseName] MODIFY FILE ( NAME = N'LogicalFileName_Log', SIZE = 8000MB )
ALTER DATABASE [DatabaseName] MODIFY FILE ( NAME = N'LogicalFileName_Log', SIZE = 16000MB )
ALTER DATABASE [DatabaseName] MODIFY FILE ( NAME = N'LogicalFileName_Log', SIZE = 24000MB )
ALTER DATABASE [DatabaseName] MODIFY FILE ( NAME = N'LogicalFileName_Log', SIZE = 32000MB )
GO

Assuming you were able to shrink this down to 10 VLFs remaining and you want it to be 32,000 MB, this would give you 74 VLFs with all new ones being 500 MB.  It goes over the 50 VLF limit I’ve seen elsewhere, but I’m very happy with these sizes and numbers.

With 8,000 MB growths the new 2014 calculation won’t kick in until the log was already 64,000 MB, and at that point an 8,000 MB VLF probably isn’t a bad thing.

Autogrowth Rates

I recommend manually growing larger log files between 8,000 and 16,000 MB at a time, but not autogrowths.  The process that causes a file to grow, and any other process that needs that space, will sit around and wait for an autogrowth to complete.  That could take a minute on descent disks, which is longer than many timeouts I’ve worked with.

Manually growing files is best, but almost every database will rely on autogrowth.  Know your timeouts, know how long it takes to grow a file, and size it accordingly.  I like to do 1,000 MB here, but will do as less if I have to.  If you can’t make a descent sized growth based on this, be more paranoid about manually growing files while leaving autogrowth set to smaller sizes.

The reason for 1,000 MB is that this is the largest size that will still give you 8 VLFs instead of being split into 16 VLFs, with the actual limit being at 1,024 MB.  If you did 2,000 MB, you’d still end up with 125 MB VLFs.  You can get that up to 250 MB each at 4,000 MB, but you’re telling your users to wait while 4,000 MB is zeroed out before they can move on.  Although the calculation changes for larger logs on SQL 2014, I’d still stick with 1,000 MB for a good autogrowth size.

Note, there is a resolved bug that would cause issues when log files grew in 4 GB increments, so you’ll see a lot of people using 8,000 MB instead of 8,192 MB.  We aren’t using an effected patch level anymore, but DBAs are made to be paranoid.  We’re not just lazy at math, although this doesn’t rule out that possibility.

TempDB

TempDB is different.  The database is recreated every time the SQL service restarts, so the log is recreated as well, following the formulas above.  If the log is over 1 GB, it starts out with 16 VLFs.  Jonathan Kehayias got into the details in his post TSQL Tuesday #11 – Misconceptions – The TempDB Log File and VLF Counts.

So TempDB never has too many on startup, but is this too few?  What if TempDB’s log is 40 GB, do you want a 2.5 GB VLF?  Is setting up TempDB to have 5 log files that are 8,000 MB each so it starts up with 500 MB VLFs a better idea?

Seriously, someone answer this one, I’m curious myself.

Changes Have Risk

The script above creates scripts to make changes.  It’s not perfectly safe to make those changes.  Test it, understand it, and be careful running it.

One of the most important pieces is that the scripts it generates will try to shrink the log as much as possible before growing it again.  In terms of cleaning up VLFs, this is perfect.  In terms of trying to run this during the day, it risks transactions failing because they’re trying to grab the next VLF as you’re running a shrink job to delete all unused VLFs.

You might be able to get away with this during the day most of the time, but it’s best to wait for a maintenance window to be safe.

What Others Did

Linchi Shea showed performance degradation from having too many small VLFs on Performance impact: a large number of virtual log files – Part I.  Updates can take almost 10x as long, and I would assume its due to the size and not number of VLFs.

SQLskills.com has blog posts that read like a series on this.  Kimberly Tripp wrote 8 Steps to better Transaction Log throughput, then followed that up with Transaction Log VLFs too many or too few?, which was updated to link to Paul Randal’s post Important change to VLF creation algorithm in SQL Server 2014.  All are must-reads if you want to really understand this topic.

Tony Rogerson (b|t) at the time of this writing has only put one post on his new blog, Transaction Log Concepts: Part 1.  If this is his typical quality of work, we have a lot to look forward to.  I’m personally looking forward to the other 3 parts of this 4 part series.

Grahm Kent (b|t) ran tests on the performance differences between two log files in his post Slow recovery times and slow performance due to large numbers of Virtual Log Files.  Both were 5 GB, but one was 16 VLFs (320 MB each) while the other was 20,480 VLFs (0.25 MB each).  It was good to see transaction performance as well as recovery performance covered.

Test It

If your database is absolutely critical to the point that squeezing an extra couple milliseconds of performance throughout the day would be noticed or if a server coming back online 15 seconds faster would save thousands of dollars, test it.  See how it performs in load tests and service restarts using your test servers and your database.

If you have a 1 TB log file and verified it needs to be about that big, what happens when you size it so you have 2,000 VLFs that are 500 MB each?  What happens when you have 100 VLFs that are 10 GB each?  Did it change recovery, any replication you’re doing, backup times, etc.?

Know that this can make a difference and that this is just another configuration change you can test out.  Crazy numbers on either side can be bad, and perfect numbers in the middle aren’t going to come from some stranger on the internet that never saw your server.

TempDB Excessive Memory Usage Example

I see TempDB using more memory than I feel it should and found a way to resolve it.  Previously I dove into technical details and questioning what I saw in my post TempDB Memory Leak? which is great for proving and debugging an issue.  Now I want to step back and talk about it from a practical perspective.

To keep it practical, I’m going to walk through a single server, step-by-step.  What I saw that caught my eye and how I applied my workaround.  This is a real, production server with screen shots from Idera Diagnostic Manager for both before and after comparisons.

What I’m Seeing

A large portion of my buffer pool is being utilized by TempDB pages which are unallocated on disk.  The easiest way to see this is this quick query:

SELECT Unallocated_MB = COUNT(1)/128
FROM sys.dm_os_buffer_descriptors bd
	LEFT JOIN sys.allocation_units au ON bd.allocation_unit_id = au.allocation_unit_id
WHERE bd.database_id = 2
	AND au.allocation_unit_id IS NULL

The details of everything in memory can be seen on my post Query the Buffer Pool.

Since these are all pointing to real, but unallocated TempDB pages on disk, I was able to develop a workaround of simply having fewer TempDB pages on disk.  AKA, I made TempDB data files smaller.

Sizing TempDB

Here we’re talking about being hurt by TempDB being too large, but we can’t lose sight of TempDB being too small hurting you as well.  Specifically, when your server is the busiest with a small TempDB it will have to stop and grow the files, then deal with any fragmentation that process caused.  So, while I’m not going to recommend filling your dedicated drive, I’m not going to recommend making TempDB tiny, either.

My recommendation is to monitor your server, find out how much space TempDB uses, and make your TempDB significantly larger than that.  The longer you have watched your server, the better.  The goal is still to avoid almost any growth possible, but I’m adding in a “don’t go crazy” clause.

You can do this yourself as I talked about in Monitoring Database and Table Sizes using the function call FileProperty(<filename>, ‘space used’).  If you do it this way, make sure you have this running for a minimum of several weeks at least once an hour, day and night.  It’s possible, not difficult to do, and not recommended for servers that have a reasonable monitoring system already in place.

If you’re doing this to your production servers you should already have monitoring software that’s watching file sizes for you, even if it’s only tracking this in the background with no obvious way to find the information in the GUI.  This is the situation I find myself in using Idera Diagnostic Manager.  The data’s there, but the GUI is set up for more immediate concerns.  I need this query to get what I want out of it.

SELECT TOP 100 S.InstanceName
	, DS.UTCCollectionDateTime
	, D.DatabaseName 
	, DataUsed_GB = CAST((DataSizeInKilobytes + IndexSizeInKilobytes) / 1024 / 1024.0 AS DEC(20,1)) 
	, LogUsed_GB = CAST(LogSizeInKilobytes / 1024 / 1024.0 AS DEC(20,1))
FROM SQLdmRepository.dbo.DatabaseSize DS
	INNER JOIN SQLdmRepository.dbo.SQLServerDatabaseNames D ON DS.DatabaseID = D.DatabaseID
	INNER JOIN SQLdmRepository.dbo.MonitoredSQLServers S ON S.SQLServerID = D.SQLServerID 
WHERE UPPER(S.InstanceName) = 'SERVER\INSTANCE'  
	AND D.DatabaseName = 'tempdb'
	AND UTCCollectionDateTime > GetUTCDate()-180
ORDER BY 4 DESC

My recommendation is to take the peak size outside of a one-time process and make the total TempDB data files at least 150% of that size.  If you have 4 TempDB data files and the peak size used is 4 GB, 150% of that is 6 GB, so make each file at least 1.5 GB.  Then set autogrowth to something reasonable because one-time processes will happen.

My Before Observations

All of the screen shots and trending information are from Idera Diagnostic Manger, but you should be able to get the same basic information out of any monitoring software.

I had a server with rather low PLE and a lot of physical I/O.

Server_Oversized_TempDB

The physical I/O is difficult to see here because this server has a lot of writes.  When you look closer you can see that it rather regularly went to 400 page reads per second.

PhysicalIO_Oversize_TempDB

All of those reads caused lots of waits on the server.  In my 12-hour sample period I saw a total of 34,000.  The units shown for this field are fine for comparison reasons, but they appear to be a total of the ms/s on the chart for values collected every 6 minutes, not the total waits.  You have to query the tables behind Idera Diagnostic Manager to get the real values.  In this case, the total waits were 138 minutes for shared and 49 for exclusive latches, for a total of 187 minutes of waiting for the 12 hours.

Waits_Oversize_TempDB

Just seeing this I wanted to request more memory on the VM, after all it only had 16 GB.  However, I made it a rule to never add memory without justifying what’s in memory first.  To do that, I used my query on Query the Buffer Pool, and this was the first line in the results:

Cache_Oversized_TempDB

Of the 8.5 GB of memory used by the buffer pool, about 6 GB of that was used by unallocated space in TempDB.  I can accept some because of how TempDB caches temp tables and other stuff, but to have 70% of the buffer pool used up while I’m seeing low PLE and high I/O is not acceptable.

My Fix

I had the files set to practically fill the dedicated drive according to best practices, so each of the 4 files was 7,000 MB adding up to almost 28 GB on a 30 GB drive.

Using the query in the Sizing TempDB section above, this server has never used more than 1 GB of data in TempDB at one time.  While that makes for some interesting questions on how it’s using 6 GB of cache, it does give me a lot of room to reduce the size.

There were no complaints about performance due to what this server is being used for, so I didn’t try to shrink TempDB.  Instead I took the patient approach an resized TempDB, which took effect the next time SQL Services restarted.  Then I waited for our scheduled server reboots for Windows Updates.

ALTER DATABASE [tempdb] MODIFY FILE ( NAME = N'tempdev',SIZE = 512MB , FILEGROWTH = 128MB )
ALTER DATABASE [tempdb] MODIFY FILE ( NAME = N'tempdev2',SIZE = 512MB , FILEGROWTH = 128MB )
ALTER DATABASE [tempdb] MODIFY FILE ( NAME = N'tempdev3',SIZE = 512MB , FILEGROWTH = 128MB )
ALTER DATABASE [tempdb] MODIFY FILE ( NAME = N'tempdev4',SIZE = 512MB , FILEGROWTH = 128MB )

Note that my recommendation above would have been to make the files at least 1.5 GB and I made them 2 GB here.  I’m not worried about exact numbers, I’m worried about being reasonable sizes that also avoid growths.  With peak observed usage at 1 GB and TempDB sized at 2 GB, any growths should be very rare.

Overall, the data files will grow at 512 MB at a time, which, when it happens, is large enough to avoid extreme fragmentation yet small enough to avoid extreme waits.  This should only happen during “I didn’t mean to do that” or “how’d it get that execution plan” moments, but it will happen.

My After Observations

After the change I waited a couple days to let the cache stabilize after a reboot.  We rebooted on Saturday, and all of these numbers are from the Tuesday after.

When I looked again, TempDB was using 1/10 of the space it was before for unallocated pages in memory.  It’s not perfect, but it’s much better.

Cache_RightSize_TempDB

TempDB using less cache allowed PLE be a lot more stable, regularly staying well above 2,000.  Using Jonathan Kehayias’s formula, PLE should be above 1,050 on a server with 14 GB of cache, so this is looking good.

Server_RightSize_TempDB

With data staying in cache more, physical I/O also dropped.  Before it was normal to see spikes to 400 page reads per second, now you’re seeing about half of that.

PhysicalIO_RightSize_TempDB

Less activity also meant less waits.  The couple spikes still went almost as high, but those are things you’ll fix more through tuning than memory management.  The totals at the bottom are what I’m focused on right now, the PageIOLatch_xx waits combined added up to about 11,000 for the day, so about 1/3 of what it was before.

Again, I don’t like how Idera Diagnostic Manager calculates the totals.  When I queried the tables I saw that there was 60 minutes of waits on shared latches and 13 minutes on exclusive latches, for a total of 73 minutes.  This is in comparison to 138 + 49 = 187 minutes before.

Waits_Rightsize_TempDB

The Downside

Even with the new, smaller size, TempDB is a lot larger than it needs to be so it would be very rare to see any growths in the near future.  However, I have to keep in mind that the load on my servers will always be increasing, so I may end up hitting autogrowth down the road.  Then I’ll reboot the servers each month with Windows Updates, it’ll shrink TempDB back down for me, and it will have to grow again the next month.

Because of this, I’ll need to visit every one of my servers from time to time (semi-annually?) to see if this is occurring and increase the size of TempDB if it is.  I’ll use the same script for determining the peak sizes because I have software that’s capturing that already, but I could find other methods to get that information if I needed to.

The only other downside I see is with servers that hit a high peak TempDB usage overnight then never come close to it again during the day.  This workaround won’t do much for those servers.  You need that space overnight, so trying to make the size smaller than what it needs at 2 AM will just make everything worse.  However, knowing about this will drive you nuts enough to look into the overnight processes to see if  you can lower peak usage.  Perhaps you can spread out some concurrent tasks or tune some bad queries that never mattered due to their timing.  It’s not a bad thing to do this work, it’s just that this probably wasn’t a good time for something to climb up your priority list.

Take a Look

Take a look at your servers.  How much cache is TempDB using?  Does TempDB ever even use half of the space allocated to it?  Is it causing issues on your servers?

Never make a change just because you saw someone say it’s a good idea, especially if they’ve never seen your servers before.  Look at the numbers on your servers for yourself, ask questions to understand it, and make the best decision for those specific servers.

If you do make this change, check TempDB before your next reboot.  Did it have to grow?  If it did, you need to change the size manually so it doesn’t have to hit an autogrowth every month.  If you shrunk it down to 2 GB total then it grew to 2.5 GB, consider making it 3.5 GB to avoid future growths while keeping the files reasonably sized.

If this was an issue on your servers and you feel SQL Server shouldn’t have functioned this way, please visit the Connect Item on this.  An up-vote is great, a comment or anything else is even better.


Shrinking Database Data Files

Normal DBAs will sum up shrinking a database data file in one word: NO!

I’ll talk to you about this subject because I’m not normal.  Still, my goal is that you’ll go from “why can’t I shrink my files” to “I don’t want to shrink my files.”

Truth be told, even when I HAVE to shrink files, I don’t want to.

Basically, you needed the space at one point in time, so you’ll probably need it again.  Unless you changed a process or something extremely rare happened, you’ll use the space again and there’s no reason to take on the issues involved with shrinking just to have a file grow again.  While this advice is mostly the same for log files, it’s different enough where I’m making a separate post for shrinking database log files

When should you shrink data files

First, a process changed where you’ll never need that amount of space again, such as the database used to keep 10 years of history but now an automated process keeps it pruned to 6 months.  This change also left you with a very significant amount of free space that you need for another purpose.

Really, that’s about it.

What happens when you shrink data files

The most common way to shrink a file is to have it reorganize pages before releasing free space, so I’ll cover that.  It basically has two steps:

  1. Fragment the file as much as possible (killing performance)
  2. Truncate the end of the file

By “reorganize” it means take the tail end of the file after the size you said you’d like the file to be shrunk to, find every populated page of data after that point, then move those pages to the first available spot you find in the file.  When the end of the file is empty, truncate it.

It’s an expensive process that leaves a big mess behind, but there are times you’ll need to go through with it (kicking and screaming).  If you do, schedule an index maintenance job immediately after this to undo most of the damage you just did and make sure the server still loves you.

Think about this, you’re considering kicking off a process where you have to tell the server you’re sorry afterwards.  You better have a good reason for this.  A 100 GB database with only 2 GB used may be a good reason to shrink.  A 100 GB database with 75 GB used is normal and healthy.

If you are going to shrink, make sure the database won’t be using that space again.  If you have a 100 GB database with only 2 GB used, does it populate, process, and purge 90 GB in an overnight process?  Find out before you shrink.

Manual Shrinking

If I haven’t scared you off yet (and I hope I did) then here’s how you shrink.

Here’s the link how to shrink a file using T-SQL: DBCC ShrinkFile

Here’s the link how to shrink a file using the GUI: SSMS Shrink File

There are Shrink Database options as well.  I don’t use it and don’t recommend it.  You know what files you want to shrink, don’t shrink them all.  When this is used it’s typically because people want to shrink their data files, but they mess up their log files while their at it.  Be nice to yourself, don’t use shrink database.

What about the Auto-Shrink option

No.

Just no.

It’s not a feature, it’s a threat.

If you have a certain amount of free space it will automatically shrink your database causing all the problems I just discussed, but it will probably kick in during your busiest time of day.  Then it won’t follow that up with index maintenance, so it just left you hopping all over your disk to find data.  The best part is that it didn’t check to see if you would need that space again, so it’ll probably grow tomorrow to get that space back.

In the example above of a 100 GB database that only uses 2 GB during the day but populates 90 GB for overnight processing, those 2 GB will be horribly fragmented, you’ll spend the resources shrinking, then you’ll take the performance hit growing the database every night as it puts the growth anywhere it can which typically means physical file fragmentation as well.  In the mean time your monitoring software will show that you have tons of free space, right up until you get the disk full error.  You can auto-shrink that database and get all those issues, or you can just let it do its job as you do yours without a maintenance nightmare.

The Connect Item on this is marked as fixed, stating that they’ll consider removing it in future versions.  This wasn’t a joke opened by some wannabe DBA.  This was serious and opened by someone who went on to become the president of the Professional Association for SQL Server.

To be fair, we all word our feelings on this differently.  I say no, Tom LaRock says never, Paul Randal says Turn It Off!, and Brent Ozar is colorful enough to come up with the term Hamster Wheel of Death.

As of the time of this writing, no one has used the term “Magical Unicorn” to describe this feature.

Sum it up

  1. Don’t shrink data files.
  2. If you didn’t listen to #1, why?
  3. Follow it up with index maintenance.
  4. Every time you try to automate this process a unicorn dies.

Entry-Level Content Challenge

I’m taking Tim Ford’s (b|tEntry-Level Content Challenge, and this is my first post with the #EntryLevel tag.  The challenge is to have one post that earns that tag each month, but I hope to exceed that.


TempDB memory leak?

I found a bug where I’m seeing TempDB use more memory than it should on multiple versions of SQL Server, especially on servers set up with common best practices. There’s a workaround that has a profound affect on server performance, adding to my belief that this is a legitimate bug and leading me to open a Connect Item on the issue.

Querying the Buffer Pool

I have a query to show me what’s in the buffer pool for the entire server, showing the expected results as well as excessive space being used by TempDB.  The newest version showing these details is on my post Querying the Buffer Pool.

It shows number of pages in the buffer pool grouped by the database, table, and index.  The query makes use of left joins so it can see space in memory that’s not currently allocated to a specific object.

The results are surprising in many ways.

The good surprises are seeing what indexes are hogging up your buffer pool so you have an idea of where to start tuning.  I’m a huge fan of this and have blogged about it in Cleaning Up the Buffer Pool to Increase PLE, although the name of my older post is misleading because it does more than just help memory management in SQL Server.

The Bug

The bad surprise was a bug which has been harassing me for quite some time now.  As I mentioned, the query will return all the space in the buffer pool, specifically the contents of sys.dm_os_buffer_descriptors, and does a left join to the tables leading up to and including sys.indexes so space not currently allocated to a table will show up.  The problem is that the space that shows up as unallocated for TempDB is much larger than expected, in this case taking up 1/3 of my buffer pool.

QueryBufferPool_TempDB

On this post I’m talking about a single server, but the problem wasn’t limited to a single server.  It showed up at the same time, caused by the same change (implementing a common best practice), partially resolved by the same partial rollback (undoing the best practice) on SQL 2008 R2, SQL 2012, and SQL 2014.

Details About the Bug

So the query I have on yesterday’s post, Querying the Buffer Pool, showed I had unallocated space in TempDB in memory, and a lot of it.  However, it doesn’t show details.

To start looking at the details, what kind of pages are these that exist in sys.dm_os_buffer_descriptors, but not in sys.allocation_units?

SELECT bd.page_type
	, MB = count(1) / 128
FROM sys.dm_os_buffer_descriptors bd
	LEFT JOIN sys.allocation_units au ON bd.allocation_unit_id = au.allocation_unit_id
WHERE bd.database_id = 2 --TempDB
	AND bd.is_modified = 0 --Let's not play dirty, only clean pages
	AND au.allocation_unit_id IS NULL --It's not even allocated
GROUP BY bd.page_type 
ORDER BY 2 DESC

TempDB_BufferPool_Unallocated

Ok, so we’re dealing with typical data in TempDB.  Well, other than it not being allocated, of course.

So I run another query to get more details.  This time I want to look inside the pages to see if they tell a different story.

SELECT TOP 100 bd.*
FROM sys.dm_os_buffer_descriptors bd
	LEFT JOIN sys.allocation_units au ON bd.allocation_unit_id = au.allocation_unit_id
WHERE bd.database_id = 2 --TempDB
	AND bd.is_modified = 0 --Let's not play dirty, only clean pages
	AND au.allocation_unit_id IS NULL --It's not even allocated

TempDB_PageLevel_Unallocated

Then I follow that up with Paul Randal’s How to use DBCC PAGE, which comes with all the disclaimers about using an undocumented and unsupported trace flag and command.  This one isn’t horrible in my mind or Paul’s comments, but remember the undocumented and unsupported parts.

DBCC TRACEON (3604);

DBCC PAGE (2, 5, 502219	, 0)
DBCC PAGE (2, 5, 374929	, 0)
DBCC PAGE (2, 5, 69868	, 0)
DBCC PAGE (2, 5, 453687	, 0)
DBCC PAGE (2, 5, 214988	, 0)
DBCC PAGE (2, 5, 440966	, 0)

DBCC TRACEOFF (3604);

The results all looked about the same to me.

DBCC_Page_Results

There are several important parts to me.  The m_objId is a negative value I can’t find in TempDB.sys.objects, so it WAS a temporary object that no longer exists.  Across the board, these are “NOT ALLOCATED”, “NOT CHANGED”, “NOT MIN_LOGGED”, “0_PCT_FULL”, so there’s nothing there.

To me it looks like temp objects made it into memory and remained in memory after the temporary objects were dropped.  I have no idea what objects these were or how they were dropped, but I’m imagining these were temp tables automatically dropped when the session was either closed or reset.

A Recent Change (A CLUE)

I found this by noticing that PLE for several servers was lower now than it has been in the past, so I was peeking in the buffer pool to see who was playing nice.  Going off of “when did PLE start to be lower” I noticed that I implemented a change around that time to use a common best practice.

That change was presizing TempDB data files to take up a vast majority of the dedicated LUN instead of letting them grow as needed.  It avoids waiting for file growth, especially if you’re using TDE (I’m not) and can’t use IFI (I can), but for several other reasons as well, including file fragmentation and the slight pause even IFI causes.  So at the start of all these festivities, I took the 4 TempDB data files from 100 MB each to 12 GB each, using up 48 GB of the 50 GB available.

A Workaround

Seeing this, I wanted to partially roll back the change the next opportunity I had.  100 MB was too small and I was aware that it invoked file growths every month (we reboot monthly for OS updates).  48 GB wasn’t right though, we just have that much space on the drive due to server build standards and paranoia (I’m a DBA).  So I went through our Idera Diagnostic Manager monitoring software and found the most space TempDB used, which is captured once an hour.  I found that 4.8 GB was the peak usage with several incidents of usage going over 4.5 GB.

With that information available and still not wanting an autogrowth for all the reasons listed above, I decided that all 4 files should be 1.5 GB, so 6 GB total.  That means peak usage was about 75% full, leaving plenty of room for error, especially with my baseline only being captured once an hour.  Autogrowth is set to 256 MB, so it’d add 1 GB total each growth.  I can live with that.

I can’t say it eliminated the issue because I still have 2 GB of unallocated TempDB space in cache, but it’s better than 8 GB.  It can be considered more acceptable than other issues I need to tackle right now, but it still bugs me.

What’s the Best Practice?

It’s a best practice to have TempDB data files on their own LUN, drive, array, however you want to word it.  Then it just make sense to have the total size of your data files add up to 90% or more of the drive size.  I see this advice everywhere, with these two standing out:

  • Solar Winds – Configuration Best Practices for SQL Server Tempdb–Initial Sizing
    • “Next, if you can give tempdb its own disk, then configure it to almost fill the drive. If nothing else will ever be on the drive, then you’re better off setting it to be larger than you’ll ever need. There’s no performance penalty, and you’ll never have to worry about autogrow again.”
  • Brent Ozar – SQL Server 2005/2008/2012/2014 Setup Checklist
    • “Notice that I don’t have filegrowth enabled.  You want to proactively create the TempDB files at their full sizes to avoid drive fragmentation.”

Jonathan Kehayias does it a little bit differently in his post SQL Server Installation Checklist saying to add space to TempDB files in 4 GB increments.  Although he doesn’t fill the drive by default, this isn’t mentioned by him, either.

Now I need to be perfectly clear on this, I trust these three sources.  I trust Jonathan and Brent more than I trust myself with setting up SQL Server.  I also feel the same about the authors I know on the Solar Winds post.  This does not change that.

Sizing TempDB like that often means it’s much larger than you need.  The workaround I’m using is to right-size these files instead.  For me, for now, I’m going to stick with seeing how large TempDB gets and make it slightly larger than that until I have a solid answer to my problem.

What Was It?

I still don’t know.  The workaround managed to knock it off of my priority list enough where I’m not actively working on it.  However, my drive to understand SQL Server better won’t leave me alone.

This post is my solution.  I have some very intelligent people reading this who I hope will at least lead me further down the rabbit hole, even if they don’t have a conclusive answer.  There’s a good chance I’ll be asking for help on Twitter with #sqlhelp or opening a connect item on this, for which I have a very well documented description of the issue that I can link to.

Updates:

2016-01-06 – Caching of Temporary Objects

Due to a comment, I started looking into the caching of temporary objects to see if this was the root cause.  The comment specifically mentioned Paul White’s (b|t) post Temporary Object Caching Explained, and I also read over Itzik Ben-Gan’s (b|t) post Caching Temporary Objects.

Both of these left me with the impression that smaller amounts of data would be left in the cache linked to temporary objects linked to the proc cache.  What I’m seeing is large amounts of data in the buffer pool that did not drop when I ran DBCC FREEPROCCACHE (on a test server that wasn’t in active use) as I expected if this was the full explanation.

While it’s very likely this is related to the issue on hand, I’m not ready to accept it as a full explanation.  If the memory associated with TempDB dropped when clearing the proc cache (on a test server) then it would have been a great explanation with a poor side effect of going too far with the memory being used.

2016-01-07 – Opened a Connect Item

I mentioned this issue on the comments of Paul White’s blog post mentioned in the last update and comments below on this post.  His response concluded with this:

So, when memory pressure is detected, I would expect memory use like this to be freed up for reuse in pretty short order, by design. If it is not, and bad things happen because memory for unallocated tempdb is not released/reused, that would be a bug.

While I was already leaning that way, it pushed me over the edge to decided it was time to open up a connect item on this issue.  I feel it’s well worth the read going to Paul’s post and the connect item.  Also, if you’re seeing this as well, an upvote on connect is very appreciated.

https://connect.microsoft.com/SQLServer/feedback/details/2215297

Monitoring Database and Table Sizes

Trending database and table sizes helps give you an idea of what to expect, and, sometimes, points out problems and their root causes. I even go so far as to monitor the disk space, file growth rates, and have a report going out telling me that “according to your current growth trends, you’ll run out of space on this day”. That last part will have to be another post since getting disk space can be kinda tricky depending on how your disks are set up; you need to go outside of SQL Server to grab the size of mountpoints if you use them. Don’t worry about mountpoints right now, if you don’t know the term that usually means that you can swap out the word “drive” and have everything I say be accurate for your environment.

First, this is lightweight stuff, there’s really no reason to capture it more than once a day, and it will only add up to several MB for a year’s worth of data. You’re not going to kill yourself doing this, you’re not going to stare at the data every day taking up your time, but you’re going to look like a heavyweight when you put this into action and reference this data to others.

Second, I do have other similar posts doing snapshots of this same info for Table and File sizes. It’s basically the same thing just different in how you’re using it and if you’ll have a historical view of it.

Database sizes

Lets start with the databases because, well, they’re bigger. I capture it all, the database name, logical file name, file type (row, logs, etc), filegroup, allocated space, used space, max size, growth rate, if it’s percent growth, and the drive/mountpoint it’s on. Other than dividing the appropriate numbers by 1024 twice to store all my sizes in MB, everything gets stored in native format. The reason for that is you have raw data in a format easy for you to verify and easy for any outsider (consultant, new employee, etc) to understand everything you have. I may make some of you cringe because I don’t normalize this; it’s small data and not worth the effort, especially with page compression (see Brad McGehee’s post on compression) turned on.

What I like doing is having automated reports with logic behind it saying “if drive size is X, file growth is Y, then you can grow to a potential size of Z”, follow that up with “the used space in this database has grown X in the last 90 days and Y in the last 30 days, so according to those trends I’ll hit the potential size in Z days”. One of my favorite reports takes that last Z as a parameter and tells me anything that will run out of space before a specific number of days. I get that report daily for anything that will run out of space in the next two weeks and a separate instance of that report monthly telling me what will run out of space in the next 100 days. For me to run out of space without having a couple automated emails sitting in my inbox yelling at me saying “See, I told you that would happen!!!”, a database has to do something crazy and out of character. The only part of that last sentence that doesn’t really happen is the automated email yelling, those voices don’t exist outside of my head (do they?).

Even without monitoring disk space, you can predict autogrowths. This is useful for trying preventing autogrowth all together if you’re into that, but with instant file initialization this has never been a spot I’ve chosen to spend my time on. However, I do care about fragmentation, and I have a report that will tell me if we continue growing according to our 30 or 90 day trends then the data files will have to grow X times. If X is higher than 4 and filegrowth is below 2 GB chunks, it shows up on my report and I change the filegrowth to make it more reasonable. If you allow percent filegrowths in your environment (just say no), or even if one sneaks through, things get complex and you have to stroll through financial websites to find the calculations for compounding interest to figure out how much the files will grow.

Cast(CEILING(LOG((Cast((ProjectedGrowthInAMonthMB - FileGroupFreeMB) as Dec(20,4)) + Cast(FileSizeMB as Dec(20,4)))/(Cast(FileSizeMB as Dec(20,4)))) /LOG(1+(Cast(Growth as Dec(20,4))/100))) AS Int)

Something inside that database is growing, but what is it?

Now if a database is growing, the first thing someone will ask you is “why is it growing”. That’s an answer I can’t give you, but “where is it growing” I can do. This is why I’m also tracking the table sizes in a database. Be fair to yourself here and admit it up front that you don’t care if a table changes size radically if the largest size is still insignificant to that database. So make up rules on “I want to watch tables that are bigger than…” and only store the stats for those tables to keep your little collections from being the source of your size issues. For me, that means that a table has to be both over 100MB in total size including indexes and over 0.5% of the size of the database. I’ve used these sizes for a while now and have never had an issue on either side; no one needed info I didn’t have for space trending issues and the collection time and space I used never caused any complaints. This isn’t saying that someone won’t ask “did that table have 10 or 11 records this time last month”, but I’m not willing to collect enough to answer every little question.

If a database is growing at an alarming rate it’s easy to assume the largest table is causing it. That’s not always the case, and it’s not too uncommon for a database change to either create a new table that grows quick intentionally or accidentally cause an old table to stop cleaning itself up. No matter what the reason is, if you want to see how a database is growing, look at your table stats documenting the growth. Developers always listen to you better when you tell them this is what happened and here’s how I know while the words “I think” are viewed as instant discredidation.

How am I supposed to do this stuff?

You’ll need somewhere to store all the info. I like to store two weeks of info on the local server and pull everything to a central server nightly where data is held for a full 13 months. However, to keep me under control, lets just focus on getting everything to the local server in the following tables.

CREATE TABLE [Drives](
    [DateAdded] [smalldatetime] NOT NULL,
    [DriveLetter] [char](1) NOT NULL,
    --[MountPoint] [smallint] NOT NULL,
    [CapacityMB] [int] NULL,
    [FreeSpaceMB] [int] NULL,
 CONSTRAINT [DBInven_Drives_DriveLetter_MountPoint_DateAdded] PRIMARY KEY CLUSTERED 
(
    [DateAdded] ASC,
    [DriveLetter] ASC,
    --[MountPoint] ASC
)WITH (PAD_INDEX  = OFF, STATISTICS_NORECOMPUTE  = OFF, IGNORE_DUP_KEY = OFF, ALLOW_ROW_LOCKS  = ON, ALLOW_PAGE_LOCKS  = ON) ON [PRIMARY]
) ON [PRIMARY]
GO

CREATE TABLE [Files](
    [DateAdded] [smalldatetime] NOT NULL,
    [DatabaseName] [sysname] NOT NULL,
    [FileName] [nvarchar](128) NOT NULL,
    [TypeDesc] [nvarchar](60) NULL,
    [FileGroup] [sysname] NULL,
    [SizeMB] [int] NULL,
    [UsedMB] [int] NULL,
    [FreeMB] [int] NULL,
    [MaxSizeMB] [int] NULL,
    [Growth] [int] NULL,
    [IsPercentGrowth] [bit] NOT NULL,
    [DriveLetter] [char](1) NOT NULL,
    --[MountPoint] [smallint] NOT NULL,
 CONSTRAINT [DBInven_Files_DatabaseID_FileID_DateAdded_U_C_IX] PRIMARY KEY CLUSTERED 
(
    [DateAdded] ASC,
    [DatabaseName] ASC,
    [FileName] ASC
)WITH (PAD_INDEX  = OFF, STATISTICS_NORECOMPUTE  = OFF, IGNORE_DUP_KEY = OFF, ALLOW_ROW_LOCKS  = ON, ALLOW_PAGE_LOCKS  = ON) ON [PRIMARY]
) ON [PRIMARY]
GO

CREATE TABLE [Tables](
    [DateAdded] [datetime] NOT NULL,
    [DatabaseName] [nvarchar](128) NOT NULL,
    [SchemaName] [nvarchar](128) NOT NULL,
    [TableName] [nvarchar](128) NOT NULL,
    [RowCounts] [bigint] NULL,
    [AllocatedMB] [int] NULL,
    [DataSizeMB] [int] NULL,
    [IndexSizeMB] [int] NULL,
    [PercentOfDB] [decimal](5, 2) NULL,
 CONSTRAINT [PK_Tables] PRIMARY KEY CLUSTERED 
(
    [DateAdded] ASC,
    [DatabaseName] ASC,
    [SchemaName] ASC,
    [TableName] ASC
)WITH (PAD_INDEX  = OFF, STATISTICS_NORECOMPUTE  = OFF, IGNORE_DUP_KEY = OFF, ALLOW_ROW_LOCKS  = ON, ALLOW_PAGE_LOCKS  = ON) ON [PRIMARY]
) ON [PRIMARY]
GO

If you use mountpoints, and if you call them “mountpoint” followed by an incrementing digit, and you never have more than can fit into a tinyint, uncommenting those pieces of the tables will do wonders for you. In case you didn’t guess, they’re commented out because the people who do use them probably don’t use them that way.

DECLARE @RunTime SmallDateTime
DECLARE @SQL NVarChar(max)

SET @RunTime = (SELECT Max(DateAdded) FROM Perf.DBInven.Drives)

SET @SQL = N'use [?]; 
    INSERT INTO Perf..Files 
    select ''' + cast(@RunTime as nvarchar(50)) + ''' 
        , DatabaseName = db_name()
        , FileName = f.Name
        , TypeDesc = f.Type_Desc
        , FileGroup = fg.Name
        , SizeMB = ((f.size*8/1024)) 
        , UsedMB = (FileProperty(f.name, ''SpaceUsed'')*8/1024) 
        , FreeMB = ((f.size-FileProperty(f.name, ''SpaceUsed''))*8/1024) 
        , MaxSizeMB = Case f.Max_Size
            WHEN -1 THEN -1
            ELSE f.Max_Size / 128
            END
        , f.Growth
        , f.Is_Percent_Growth
        , DriveLetter = left(f.physical_name,1) 
        /*, MountPoint = CASE substring(f.physical_name,4,10)
            WHEN ''MountPoint'' THEN 
                Case isnumeric(substring(f.physical_name,14,4)) --MountPoint >= 1000
                WHEN 1 THEN substring(f.physical_name,14,4)
                ELSE Case isnumeric(substring(f.physical_name,14,3)) --MountPoint >= 100
                    WHEN 1 THEN substring(f.physical_name,14,3)
                    ELSE Case isnumeric(substring(f.physical_name,14,2)) --MountPoint >= 10
                        WHEN 1 THEN substring(f.physical_name,14,2)
                        ELSE substring(f.physical_name,14,1) -- MountPoint single digit
                        END
                    END
                END
            ELSE Cast(0 as varchar(10)) --Root drive is MountPoint 0 
            END*/
    from sys.database_files f
        LEFT JOIN sys.filegroups fg ON f.data_space_id = fg.data_space_id
    '

exec sp_MSforeachdb @SQL

And now to grab the tables. Keep in mind that I specifically only want to grab stuff over 0.5% of the database size AND over 100 MB. You’ll see that towards the end of the code.

DECLARE @SQL NVarChar(max)
DECLARE @DateAdded SmallDateTime

SELECT @DateAdded = MAX(DateAdded) FROM Perf.DBInven.Drives 

SET @SQL = ' Use [?];
    DECLARE @DatabaseSize Float

    IF OBJECT_ID(''tempdb..#TableSizes'') IS NOT NULL BEGIN
          DROP TABLE #TableSizes
    END

    SELECT DatabaseName = DB_NAME()
    , TableName = a2.name
    , SchemaName = a3.name
    , RowCounts = a1.rows
    , TableSizeMB = (a1.reserved + ISNULL(a4.reserved,0)) / 128
    , DataSizeMB = a1.data / 128
    , IndexSizeMB = (CASE WHEN (a1.used + ISNULL(a4.used,0)) > a1.data 
                        THEN (a1.used + ISNULL(a4.used,0)) - a1.data 
                        ELSE 0 
                    END) /128
INTO #TableSizes
FROM (SELECT ps.object_id
            , [rows] = SUM(CASE
                                WHEN (ps.index_id < 2) THEN row_count
                                ELSE 0
                            END)
            , reserved = SUM(ps.reserved_page_count)
            , data = SUM(CASE
                            WHEN (ps.index_id < 2) 
                                THEN (ps.in_row_data_page_count + ps.lob_used_page_count + ps.row_overflow_used_page_count)
                            ELSE (ps.lob_used_page_count + ps.row_overflow_used_page_count)
                        END)
            , used = SUM (ps.used_page_count) 
        FROM sys.dm_db_partition_stats ps
        GROUP BY ps.object_id) AS a1
    INNER JOIN sys.all_objects a2  ON a1.object_id = a2.object_id
    INNER JOIN sys.schemas a3 ON a2.schema_id = a3.schema_id
    LEFT JOIN (SELECT it.parent_id
            , reserved = SUM(ps.reserved_page_count)
            , used = SUM(ps.used_page_count)
        FROM sys.dm_db_partition_stats ps
            INNER JOIN sys.internal_tables it ON it.object_id = ps.object_id
        WHERE it.internal_type IN (202,204)
        GROUP BY it.parent_id) AS a4 ON a4.parent_id = a1.object_id
WHERE a2.type <> ''S'' and a2.type <> ''IT''

    SELECT @DatabaseSize = Sum(TableSizeMB) FROM #TableSizes

    INSERT INTO Perf..[Tables]
    SELECT ''' + Cast(@DateAdded as VarChar(50)) + '''
        , DatabaseName
        , SchemaName
        , TableName
        , RowCounts
        , TableSizeMB
        , DataSizeMB
        , IndexSizeMB
        , (TableSizeMB/@DatabaseSize) * 100 
    FROM #TableSizes
    WHERE TableSizeMB > .005 * @DatabaseSize 
        AND TableSizeMB > 100

    DROP TABLE #TableSizes'

exec sp_MSforeachdb @SQL

So this leaves us with the size of the drives. This isn’t an easy subject. You can get everything you need through SQL Server if you don’t use mountpoints, but you’re left with either Powershell or VBScript to capture it with mountpoints so you can query WMI. Another post, another day. I’d actually prefer to rewrite my VBScript as PowerShell to both learn PowerShell and put a better solution out here for you.

This was my last post I needed to prep for my Monitoring and Baselines Presentation for SQL Saturday where I talk about what you want to watch and why. Since the presentation didn’t get into how to watch everything, I made sure that everything was on my blog ahead of time.

File Sizes

There are two scripts I like to use to look at the file sizes on servers.  The first one is everything I could hope for on servers where there is only a single file per filegroup.  All of the vital information is all in one place.  I know, DBAs tend to be good at math and there was no need for me to make all of these columns.  However, any room I leave to demonstrate my mathematical powers in a professional environment…. Ok, look, CPU time is cheap anymore, I’ll go with that for my reasoning.

IF Object_ID('TempDB..##FileSize') IS NOT NULL BEGIN
    DROP TABLE ##FileSize
END

CREATE TABLE ##FileSize
(      DB VarChar(128)
    , FileLogicalName VarChar(128)
    , FilePhysicalName VarChar(512)
    , FileGroup VarChar(128)
    , Used_MB VarChar(128)
    , Free_MB VarChar(128)
    , Size_MB VarChar(128)
    , GrowthRate VarChar(128)
    , MaxSize VarChar(128)
)

exec sp_MSforeachdb N'use [?]; 
INSERT INTO ##FileSize
SELECT DB = db_name()
    , FileLogicalName = f.name
    , FilePhysicalName = f.physical_name
    , FileGroup = ISNULL(g.name, f.Type_Desc) 
    , Used_MB = REPLACE(CONVERT(varchar(100), (CAST((FileProperty(f.name, ''SpaceUsed'')) / 128 AS money)), 1), ''.00'', '''')
    , Free_MB = REPLACE(CONVERT(varchar(100), (CAST((f.size - FileProperty(f.name, ''SpaceUsed'')) / 128 AS money)), 1), ''.00'', '''')
    , Size_MB = REPLACE(CONVERT(varchar(100), (CAST((f.size) / 128 AS money)), 1), ''.00'', '''')
    , GrowthRate = Case Is_Percent_Growth
                    WHEN 1 THEN '''' + Cast(Growth as VarChar(100)) + ''%''
                    ELSE REPLACE(CONVERT(varchar(100), (CAST(Growth/128 AS money)), 1), ''.00'', '''') + '' MB''
                    END 
    , MaxSize = Case Max_Size
                    WHEN -1 THEN ''---''
                    WHEN 268435456 THEN ''---''
                    ELSE REPLACE(CONVERT(varchar(100), (CAST(Max_Size/128 AS money)), 1), ''.00'', '''') + '' MB''
                    END
FROM sys.database_files f
    LEFT JOIN sys.filegroups g on f.data_space_id = g.data_space_id
'

SELECT *
    , PctUsed = Cast(100 * replace(Used_MB, ',', '') / (Cast(replace(Size_MB,',', '') as Dec(20,2)) + .01) as Dec(20,2))
    --, PctFree = 100 - Cast(100 * replace(Used_MB, ',', '') / (Cast(replace(Size_MB,',', '') as Dec(20,2)) + .01) as Dec(20,2))
FROM ##FileSize
--WHERE DB = 'msdb'
ORDER BY FilePhysicalName

DROP TABLE ##FileSize

The problem with that script is that there are times it makes sense to have multiple files in a filegroup.  Be it disk limitations, best practices on a SAN saying not to extend a LUN, or your predecessor tossed logic to the wind, there are many reasons you could have multiple files where the previous script leaves you doing math to figure out how big the filegroup is or how much room for growth you have.  You know what I said about doing math…CPU time is cheap.  Here’s what I use when I need to see the filegroup sizes.

IF Object_ID('TempDB..##FileGroupSize') IS NOT NULL BEGIN
    DROP TABLE ##FileGroupSize
END

CREATE TABLE ##FileGroupSize
(      DB VarChar(128)
    , FileGroup VarChar(128)
    , Used_MB Int
    , Free_MB Int
    , Size_MB Int
)

exec sp_MSforeachdb N'use [?]; 
INSERT INTO ##FileGroupSize
SELECT DB = db_name()
    , FileGroup = ISNULL(g.name, f.Type_Desc) 
    , Used_MB = SUM(FileProperty(f.name, ''SpaceUsed'')) / 128
    , Free_MB = SUM(f.size - FileProperty(f.name, ''SpaceUsed'')) / 128
    , Size_MB = SUM(f.size) / 128 
FROM sys.database_files f
    LEFT JOIN sys.filegroups g on f.data_space_id = g.data_space_id
GROUP BY f.Type_Desc, g.name
'

SELECT *
    , PctUsed = Cast(100 * Used_MB / (Cast(Size_MB as Dec(20,2)) + .01) as Dec(20,2))
    , PctFree = 100 - Cast(100 * Used_MB / (Cast(Size_MB as Dec(20,2)) + .01) as Dec(20,2))
FROM ##FileGroupSize
ORDER BY DB, FileGroup

DROP TABLE ##FileGroupSize

It should be noted that I have different rules for different situations.  If a script is part of a stored proc or view then * isn’t even a consideration.  If an external program, even an SSRS report, will consume the code then I would never try to format it using SQL.  However, these are saved in my scripts folder as FileSize.sql and FilegroupSizes.sql, and my personal .sql files get to break a rule or two.