TempDB Excessive Memory Usage Example

I see TempDB using more memory than I feel it should and found a way to resolve it.  Previously I dove into technical details and questioning what I saw in my post TempDB Memory Leak? which is great for proving and debugging an issue.  Now I want to step back and talk about it from a practical perspective.

To keep it practical, I’m going to walk through a single server, step-by-step.  What I saw that caught my eye and how I applied my workaround.  This is a real, production server with screen shots from Idera Diagnostic Manager for both before and after comparisons.

What I’m Seeing

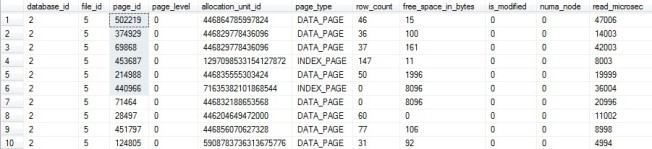
A large portion of my buffer pool is being utilized by TempDB pages which are unallocated on disk.  The easiest way to see this is this quick query:

SELECT Unallocated_MB = COUNT(1)/128
FROM sys.dm_os_buffer_descriptors bd
	LEFT JOIN sys.allocation_units au ON bd.allocation_unit_id = au.allocation_unit_id
WHERE bd.database_id = 2
	AND au.allocation_unit_id IS NULL

The details of everything in memory can be seen on my post Query the Buffer Pool.

Since these are all pointing to real, but unallocated TempDB pages on disk, I was able to develop a workaround of simply having fewer TempDB pages on disk.  AKA, I made TempDB data files smaller.

Sizing TempDB

Here we’re talking about being hurt by TempDB being too large, but we can’t lose sight of TempDB being too small hurting you as well.  Specifically, when your server is the busiest with a small TempDB it will have to stop and grow the files, then deal with any fragmentation that process caused.  So, while I’m not going to recommend filling your dedicated drive, I’m not going to recommend making TempDB tiny, either.

My recommendation is to monitor your server, find out how much space TempDB uses, and make your TempDB significantly larger than that.  The longer you have watched your server, the better.  The goal is still to avoid almost any growth possible, but I’m adding in a “don’t go crazy” clause.

You can do this yourself as I talked about in Monitoring Database and Table Sizes using the function call FileProperty(<filename>, ‘space used’).  If you do it this way, make sure you have this running for a minimum of several weeks at least once an hour, day and night.  It’s possible, not difficult to do, and not recommended for servers that have a reasonable monitoring system already in place.

If you’re doing this to your production servers you should already have monitoring software that’s watching file sizes for you, even if it’s only tracking this in the background with no obvious way to find the information in the GUI.  This is the situation I find myself in using Idera Diagnostic Manager.  The data’s there, but the GUI is set up for more immediate concerns.  I need this query to get what I want out of it.

SELECT TOP 100 S.InstanceName
	, DS.UTCCollectionDateTime
	, D.DatabaseName 
	, DataUsed_GB = CAST((DataSizeInKilobytes + IndexSizeInKilobytes) / 1024 / 1024.0 AS DEC(20,1)) 
	, LogUsed_GB = CAST(LogSizeInKilobytes / 1024 / 1024.0 AS DEC(20,1))
FROM SQLdmRepository.dbo.DatabaseSize DS
	INNER JOIN SQLdmRepository.dbo.SQLServerDatabaseNames D ON DS.DatabaseID = D.DatabaseID
	INNER JOIN SQLdmRepository.dbo.MonitoredSQLServers S ON S.SQLServerID = D.SQLServerID 
WHERE UPPER(S.InstanceName) = 'SERVER\INSTANCE'  
	AND D.DatabaseName = 'tempdb'
	AND UTCCollectionDateTime > GetUTCDate()-180
ORDER BY 4 DESC

My recommendation is to take the peak size outside of a one-time process and make the total TempDB data files at least 150% of that size.  If you have 4 TempDB data files and the peak size used is 4 GB, 150% of that is 6 GB, so make each file at least 1.5 GB.  Then set autogrowth to something reasonable because one-time processes will happen.

My Before Observations

All of the screen shots and trending information are from Idera Diagnostic Manger, but you should be able to get the same basic information out of any monitoring software.

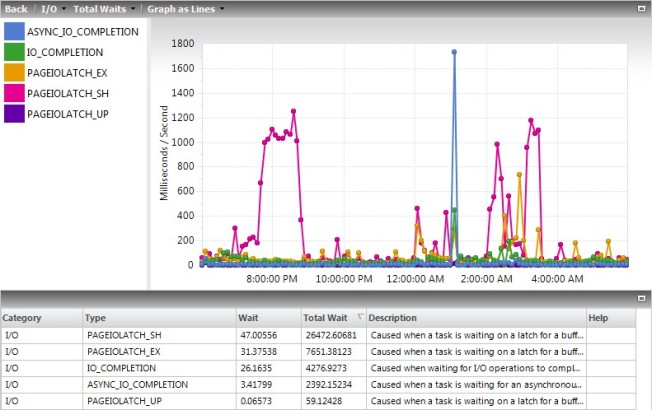
I had a server with rather low PLE and a lot of physical I/O.

Server_Oversized_TempDB

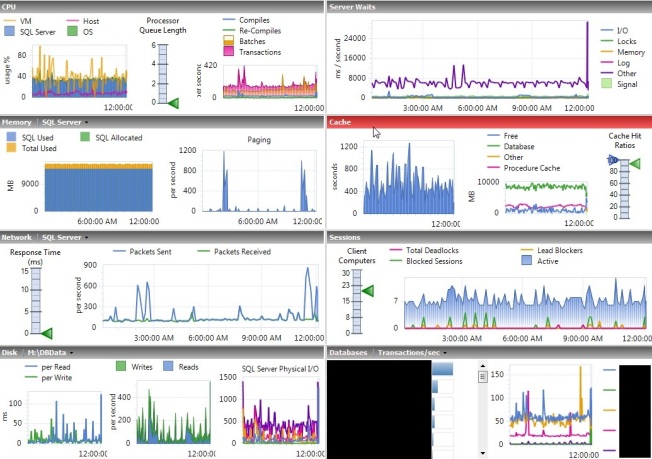
The physical I/O is difficult to see here because this server has a lot of writes.  When you look closer you can see that it rather regularly went to 400 page reads per second.

PhysicalIO_Oversize_TempDB

All of those reads caused lots of waits on the server.  In my 12-hour sample period I saw a total of 34,000.  The units shown for this field are fine for comparison reasons, but they appear to be a total of the ms/s on the chart for values collected every 6 minutes, not the total waits.  You have to query the tables behind Idera Diagnostic Manager to get the real values.  In this case, the total waits were 138 minutes for shared and 49 for exclusive latches, for a total of 187 minutes of waiting for the 12 hours.

Waits_Oversize_TempDB

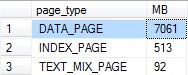
Just seeing this I wanted to request more memory on the VM, after all it only had 16 GB.  However, I made it a rule to never add memory without justifying what’s in memory first.  To do that, I used my query on Query the Buffer Pool, and this was the first line in the results:

Cache_Oversized_TempDB

Of the 8.5 GB of memory used by the buffer pool, about 6 GB of that was used by unallocated space in TempDB.  I can accept some because of how TempDB caches temp tables and other stuff, but to have 70% of the buffer pool used up while I’m seeing low PLE and high I/O is not acceptable.

My Fix

I had the files set to practically fill the dedicated drive according to best practices, so each of the 4 files was 7,000 MB adding up to almost 28 GB on a 30 GB drive.

Using the query in the Sizing TempDB section above, this server has never used more than 1 GB of data in TempDB at one time.  While that makes for some interesting questions on how it’s using 6 GB of cache, it does give me a lot of room to reduce the size.

There were no complaints about performance due to what this server is being used for, so I didn’t try to shrink TempDB.  Instead I took the patient approach an resized TempDB, which took effect the next time SQL Services restarted.  Then I waited for our scheduled server reboots for Windows Updates.

ALTER DATABASE [tempdb] MODIFY FILE ( NAME = N'tempdev',SIZE = 512MB , FILEGROWTH = 128MB )
ALTER DATABASE [tempdb] MODIFY FILE ( NAME = N'tempdev2',SIZE = 512MB , FILEGROWTH = 128MB )
ALTER DATABASE [tempdb] MODIFY FILE ( NAME = N'tempdev3',SIZE = 512MB , FILEGROWTH = 128MB )
ALTER DATABASE [tempdb] MODIFY FILE ( NAME = N'tempdev4',SIZE = 512MB , FILEGROWTH = 128MB )

Note that my recommendation above would have been to make the files at least 1.5 GB and I made them 2 GB here.  I’m not worried about exact numbers, I’m worried about being reasonable sizes that also avoid growths.  With peak observed usage at 1 GB and TempDB sized at 2 GB, any growths should be very rare.

Overall, the data files will grow at 512 MB at a time, which, when it happens, is large enough to avoid extreme fragmentation yet small enough to avoid extreme waits.  This should only happen during “I didn’t mean to do that” or “how’d it get that execution plan” moments, but it will happen.

My After Observations

After the change I waited a couple days to let the cache stabilize after a reboot.  We rebooted on Saturday, and all of these numbers are from the Tuesday after.

When I looked again, TempDB was using 1/10 of the space it was before for unallocated pages in memory.  It’s not perfect, but it’s much better.

Cache_RightSize_TempDB

TempDB using less cache allowed PLE be a lot more stable, regularly staying well above 2,000.  Using Jonathan Kehayias’s formula, PLE should be above 1,050 on a server with 14 GB of cache, so this is looking good.

Server_RightSize_TempDB

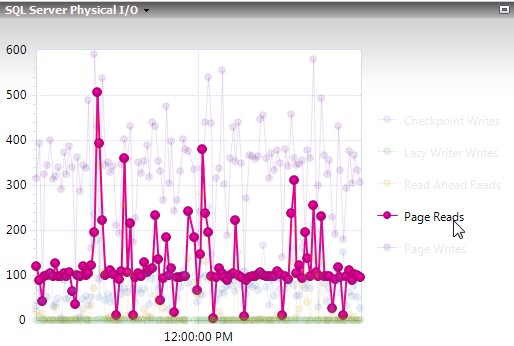
With data staying in cache more, physical I/O also dropped.  Before it was normal to see spikes to 400 page reads per second, now you’re seeing about half of that.

PhysicalIO_RightSize_TempDB

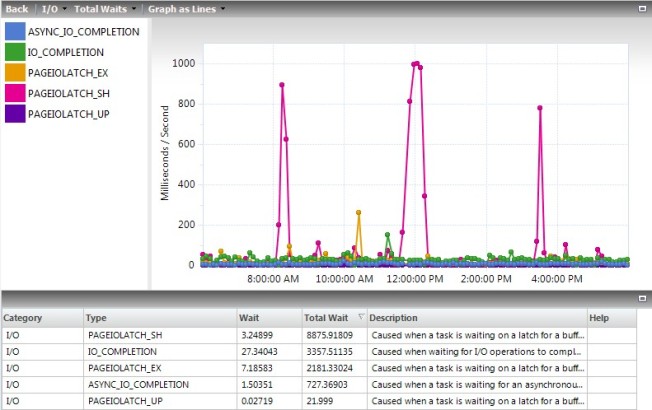
Less activity also meant less waits.  The couple spikes still went almost as high, but those are things you’ll fix more through tuning than memory management.  The totals at the bottom are what I’m focused on right now, the PageIOLatch_xx waits combined added up to about 11,000 for the day, so about 1/3 of what it was before.

Again, I don’t like how Idera Diagnostic Manager calculates the totals.  When I queried the tables I saw that there was 60 minutes of waits on shared latches and 13 minutes on exclusive latches, for a total of 73 minutes.  This is in comparison to 138 + 49 = 187 minutes before.

Waits_Rightsize_TempDB

The Downside

Even with the new, smaller size, TempDB is a lot larger than it needs to be so it would be very rare to see any growths in the near future.  However, I have to keep in mind that the load on my servers will always be increasing, so I may end up hitting autogrowth down the road.  Then I’ll reboot the servers each month with Windows Updates, it’ll shrink TempDB back down for me, and it will have to grow again the next month.

Because of this, I’ll need to visit every one of my servers from time to time (semi-annually?) to see if this is occurring and increase the size of TempDB if it is.  I’ll use the same script for determining the peak sizes because I have software that’s capturing that already, but I could find other methods to get that information if I needed to.

The only other downside I see is with servers that hit a high peak TempDB usage overnight then never come close to it again during the day.  This workaround won’t do much for those servers.  You need that space overnight, so trying to make the size smaller than what it needs at 2 AM will just make everything worse.  However, knowing about this will drive you nuts enough to look into the overnight processes to see if  you can lower peak usage.  Perhaps you can spread out some concurrent tasks or tune some bad queries that never mattered due to their timing.  It’s not a bad thing to do this work, it’s just that this probably wasn’t a good time for something to climb up your priority list.

Take a Look

Take a look at your servers.  How much cache is TempDB using?  Does TempDB ever even use half of the space allocated to it?  Is it causing issues on your servers?

Never make a change just because you saw someone say it’s a good idea, especially if they’ve never seen your servers before.  Look at the numbers on your servers for yourself, ask questions to understand it, and make the best decision for those specific servers.

If you do make this change, check TempDB before your next reboot.  Did it have to grow?  If it did, you need to change the size manually so it doesn’t have to hit an autogrowth every month.  If you shrunk it down to 2 GB total then it grew to 2.5 GB, consider making it 3.5 GB to avoid future growths while keeping the files reasonably sized.

If this was an issue on your servers and you feel SQL Server shouldn’t have functioned this way, please visit the Connect Item on this.  An up-vote is great, a comment or anything else is even better.


Advertisement

TempDB memory leak?

I found a bug where I’m seeing TempDB use more memory than it should on multiple versions of SQL Server, especially on servers set up with common best practices. There’s a workaround that has a profound affect on server performance, adding to my belief that this is a legitimate bug and leading me to open a Connect Item on the issue.

Querying the Buffer Pool

I have a query to show me what’s in the buffer pool for the entire server, showing the expected results as well as excessive space being used by TempDB.  The newest version showing these details is on my post Querying the Buffer Pool.

It shows number of pages in the buffer pool grouped by the database, table, and index.  The query makes use of left joins so it can see space in memory that’s not currently allocated to a specific object.

The results are surprising in many ways.

The good surprises are seeing what indexes are hogging up your buffer pool so you have an idea of where to start tuning.  I’m a huge fan of this and have blogged about it in Cleaning Up the Buffer Pool to Increase PLE, although the name of my older post is misleading because it does more than just help memory management in SQL Server.

The Bug

The bad surprise was a bug which has been harassing me for quite some time now.  As I mentioned, the query will return all the space in the buffer pool, specifically the contents of sys.dm_os_buffer_descriptors, and does a left join to the tables leading up to and including sys.indexes so space not currently allocated to a table will show up.  The problem is that the space that shows up as unallocated for TempDB is much larger than expected, in this case taking up 1/3 of my buffer pool.

QueryBufferPool_TempDB

On this post I’m talking about a single server, but the problem wasn’t limited to a single server.  It showed up at the same time, caused by the same change (implementing a common best practice), partially resolved by the same partial rollback (undoing the best practice) on SQL 2008 R2, SQL 2012, and SQL 2014.

Details About the Bug

So the query I have on yesterday’s post, Querying the Buffer Pool, showed I had unallocated space in TempDB in memory, and a lot of it.  However, it doesn’t show details.

To start looking at the details, what kind of pages are these that exist in sys.dm_os_buffer_descriptors, but not in sys.allocation_units?

SELECT bd.page_type
	, MB = count(1) / 128
FROM sys.dm_os_buffer_descriptors bd
	LEFT JOIN sys.allocation_units au ON bd.allocation_unit_id = au.allocation_unit_id
WHERE bd.database_id = 2 --TempDB
	AND bd.is_modified = 0 --Let's not play dirty, only clean pages
	AND au.allocation_unit_id IS NULL --It's not even allocated
GROUP BY bd.page_type 
ORDER BY 2 DESC

TempDB_BufferPool_Unallocated

Ok, so we’re dealing with typical data in TempDB.  Well, other than it not being allocated, of course.

So I run another query to get more details.  This time I want to look inside the pages to see if they tell a different story.

SELECT TOP 100 bd.*
FROM sys.dm_os_buffer_descriptors bd
	LEFT JOIN sys.allocation_units au ON bd.allocation_unit_id = au.allocation_unit_id
WHERE bd.database_id = 2 --TempDB
	AND bd.is_modified = 0 --Let's not play dirty, only clean pages
	AND au.allocation_unit_id IS NULL --It's not even allocated

TempDB_PageLevel_Unallocated

Then I follow that up with Paul Randal’s How to use DBCC PAGE, which comes with all the disclaimers about using an undocumented and unsupported trace flag and command.  This one isn’t horrible in my mind or Paul’s comments, but remember the undocumented and unsupported parts.

DBCC TRACEON (3604);

DBCC PAGE (2, 5, 502219	, 0)
DBCC PAGE (2, 5, 374929	, 0)
DBCC PAGE (2, 5, 69868	, 0)
DBCC PAGE (2, 5, 453687	, 0)
DBCC PAGE (2, 5, 214988	, 0)
DBCC PAGE (2, 5, 440966	, 0)

DBCC TRACEOFF (3604);

The results all looked about the same to me.

DBCC_Page_Results

There are several important parts to me.  The m_objId is a negative value I can’t find in TempDB.sys.objects, so it WAS a temporary object that no longer exists.  Across the board, these are “NOT ALLOCATED”, “NOT CHANGED”, “NOT MIN_LOGGED”, “0_PCT_FULL”, so there’s nothing there.

To me it looks like temp objects made it into memory and remained in memory after the temporary objects were dropped.  I have no idea what objects these were or how they were dropped, but I’m imagining these were temp tables automatically dropped when the session was either closed or reset.

A Recent Change (A CLUE)

I found this by noticing that PLE for several servers was lower now than it has been in the past, so I was peeking in the buffer pool to see who was playing nice.  Going off of “when did PLE start to be lower” I noticed that I implemented a change around that time to use a common best practice.

That change was presizing TempDB data files to take up a vast majority of the dedicated LUN instead of letting them grow as needed.  It avoids waiting for file growth, especially if you’re using TDE (I’m not) and can’t use IFI (I can), but for several other reasons as well, including file fragmentation and the slight pause even IFI causes.  So at the start of all these festivities, I took the 4 TempDB data files from 100 MB each to 12 GB each, using up 48 GB of the 50 GB available.

A Workaround

Seeing this, I wanted to partially roll back the change the next opportunity I had.  100 MB was too small and I was aware that it invoked file growths every month (we reboot monthly for OS updates).  48 GB wasn’t right though, we just have that much space on the drive due to server build standards and paranoia (I’m a DBA).  So I went through our Idera Diagnostic Manager monitoring software and found the most space TempDB used, which is captured once an hour.  I found that 4.8 GB was the peak usage with several incidents of usage going over 4.5 GB.

With that information available and still not wanting an autogrowth for all the reasons listed above, I decided that all 4 files should be 1.5 GB, so 6 GB total.  That means peak usage was about 75% full, leaving plenty of room for error, especially with my baseline only being captured once an hour.  Autogrowth is set to 256 MB, so it’d add 1 GB total each growth.  I can live with that.

I can’t say it eliminated the issue because I still have 2 GB of unallocated TempDB space in cache, but it’s better than 8 GB.  It can be considered more acceptable than other issues I need to tackle right now, but it still bugs me.

What’s the Best Practice?

It’s a best practice to have TempDB data files on their own LUN, drive, array, however you want to word it.  Then it just make sense to have the total size of your data files add up to 90% or more of the drive size.  I see this advice everywhere, with these two standing out:

  • Solar Winds – Configuration Best Practices for SQL Server Tempdb–Initial Sizing
    • “Next, if you can give tempdb its own disk, then configure it to almost fill the drive. If nothing else will ever be on the drive, then you’re better off setting it to be larger than you’ll ever need. There’s no performance penalty, and you’ll never have to worry about autogrow again.”
  • Brent Ozar – SQL Server 2005/2008/2012/2014 Setup Checklist
    • “Notice that I don’t have filegrowth enabled.  You want to proactively create the TempDB files at their full sizes to avoid drive fragmentation.”

Jonathan Kehayias does it a little bit differently in his post SQL Server Installation Checklist saying to add space to TempDB files in 4 GB increments.  Although he doesn’t fill the drive by default, this isn’t mentioned by him, either.

Now I need to be perfectly clear on this, I trust these three sources.  I trust Jonathan and Brent more than I trust myself with setting up SQL Server.  I also feel the same about the authors I know on the Solar Winds post.  This does not change that.

Sizing TempDB like that often means it’s much larger than you need.  The workaround I’m using is to right-size these files instead.  For me, for now, I’m going to stick with seeing how large TempDB gets and make it slightly larger than that until I have a solid answer to my problem.

What Was It?

I still don’t know.  The workaround managed to knock it off of my priority list enough where I’m not actively working on it.  However, my drive to understand SQL Server better won’t leave me alone.

This post is my solution.  I have some very intelligent people reading this who I hope will at least lead me further down the rabbit hole, even if they don’t have a conclusive answer.  There’s a good chance I’ll be asking for help on Twitter with #sqlhelp or opening a connect item on this, for which I have a very well documented description of the issue that I can link to.

Updates:

2016-01-06 – Caching of Temporary Objects

Due to a comment, I started looking into the caching of temporary objects to see if this was the root cause.  The comment specifically mentioned Paul White’s (b|t) post Temporary Object Caching Explained, and I also read over Itzik Ben-Gan’s (b|t) post Caching Temporary Objects.

Both of these left me with the impression that smaller amounts of data would be left in the cache linked to temporary objects linked to the proc cache.  What I’m seeing is large amounts of data in the buffer pool that did not drop when I ran DBCC FREEPROCCACHE (on a test server that wasn’t in active use) as I expected if this was the full explanation.

While it’s very likely this is related to the issue on hand, I’m not ready to accept it as a full explanation.  If the memory associated with TempDB dropped when clearing the proc cache (on a test server) then it would have been a great explanation with a poor side effect of going too far with the memory being used.

2016-01-07 – Opened a Connect Item

I mentioned this issue on the comments of Paul White’s blog post mentioned in the last update and comments below on this post.  His response concluded with this:

So, when memory pressure is detected, I would expect memory use like this to be freed up for reuse in pretty short order, by design. If it is not, and bad things happen because memory for unallocated tempdb is not released/reused, that would be a bug.

While I was already leaning that way, it pushed me over the edge to decided it was time to open up a connect item on this issue.  I feel it’s well worth the read going to Paul’s post and the connect item.  Also, if you’re seeing this as well, an upvote on connect is very appreciated.

https://connect.microsoft.com/SQLServer/feedback/details/2215297