Recompile Monitoring using XEvents

Recompiles can be a hidden bottleneck on your server, and it may not be too obvious.  I should know, it happened to me.  Unfortunately for me, that was before I was a proponent of tracing or using XEvents to watch for recompiles.  Fortunately for you, the experience changed me, and I enjoy sharing my experiences.

What happened to me was a proc that was called WAY too often was taking too long cumulatively.  I knew the true root cause of my issue was in the application which was calling the proc once per row, often for about hundred rows, when loading a pretty important page on a web application.  However, I just found out the service desk has been getting complaints for a while, and asking the development team to help me rewrite how the page works ended in an answer that didn’t even sound like now.  Well, I guess “no” does kinda sound like “now”…

The proc was pretty simple, taking on average about 0.150 seconds to run.  Sounds great until you remember that it’s being called about a hundred times for a page load on a web application.  100 * 0.15 = 15 seconds for the page to load, not counting anything else running.  Users were threatening to not be users anymore even though they were happy with most other aspects.

I got into it, reworded the query a little, created a perfect index for it, and it got it down to 0.100 seconds to run.  This was a large concession on my part because I HATE perfect indexes for a single query, and feel strongly that indexes should focus more on being reusable by many queries.  However, even that only got the web page to load in 10 seconds.

Traces of the proc confused me.  The statements were running in 0.010 seconds, and there was a 0.090 second gap between runs.  That gap was 9 of my 10 seconds.  At 10 seconds users avoid a website, but at 1 second users have to be prompted to say it’s not as fast as they’d like.

It took me longer than I’d like to admit to figure out that every run was kicking off a recompile that took 0.090 seconds.  This is the point where I started tracing for the recompile reason, and found out it was because statistics were being updated.  However, there were no stats in my database that were updated in the last 15 minutes, so I would have never guessed this was the reason without tracing on this event.

This proc loaded data into a temp table, then did some processing on that temp table, and I figured out that there were enough rows being loaded into the temp table to update the stats on it.  Removing the temp table was a disaster, it raised my execution time by 0.010 seconds.  Yeah, “disaster” can be relative…

Then I came up with a very odd solution that I’ve never seen or heard of before that point, and I haven’t used much since that point.  The temp table was swapped out for a table variable.  No stats to be updated, so no recompile.  Although it assumed there would only be one record in the table variable (it always does), the execution plan was the same.  The only difference was the total 0.100 second duration was dropped to 0.010 after losing the 0.090 recompile.

User experience was now a web page that loaded up in just over 1 second, with most of it still being this query.  There wasn’t anything more I could do except wait until the page could be rewritten by development where I could rewrite it to get all the results at once.  That process took time, and customers were not impatiently watching to see when it would happen.

I wrote this talking about the users, and users care about duration.  However, that’s not the whole story.  The 0.090 recompile was pure CPU time, it happening 100 times per page call added up to 9 seconds of pure CPU time, and the users having to use this page hundreds of times a day added up to a noticeable impact on the server performance when it went away.  Now I admit that the users only used this when they HAD to instead of when they should have, so it was balanced out a little by the users opening the page about twice as often.  Even then, it was still obvious that it was gone when comparing long-term CPU usage.

The Management Response

Side note for all of you managers out there…  My manager pulled me aside the next week saying “step into my office for a second.”.  I admit, that statement always makes you nervous, even when you KNOW everything is going great.  He proceeded to tell me that before I started with the company they pulled developers and a DBA into a task force that spent tons of money to improve performance, upgrading servers, upgrading the SAN, upping the WAN speed, and looking into the database.  Then he said that I did more in one day than they did in 6 months without spending any money, and that I should take my wife out for a nice dinner and bring him the receipt.

Now I know that the hardware upgrades helped out, that I only helped a single process that day, and many other things that could belittle what happened.  I also know that spending $100 was very minor in terms of the effect that change made for the company.  That’s not how I saw things.

What I saw was a response that stuck with me, a lot.  Management stepped back to recognize a difference someone made, and made sure they knew they were appreciated.  Then took it a step further bringing the family into it, having my wife feeling proud and appreciated at the same time.

I know the constraints management is under and all the things they can’t do.  That being said, the only thing that frustrates me about this situation is that I don’t see others in management taking the same approach.  I swore from that point that if I ever became a manager my one odd request would be that I would want a very small budget in writing to use at my digression.  Small things to show appreciation go a long way.

My Challenge

The challenging part for me, and where I felt I didn’t do as well as I should have done, is that this flew under my radar.  I was tracing for anything that took over 1 second duration and was looking at the most expensive queries all the time.  However, this one took 0.150 seconds and never accumulated time in the plan cache due to the recompiles.

Here’s the thing, I pride myself on being specialized in database performance, so I feel I should have seen this before having someone in customer service casually mention it to me in conversation.  It wasn’t even a request to look into it, just mentioning he just got off a call with the customer about the page, and that the page never worked right with no one being able to fix it.

After finding and resolving the root cause of the proc, I also wanted to find and resolve how this flew under my radar.  This came up to two primary responses.  First, the page was taking too long as a whole, so I requested stats on a per-page basis – how long it took to load each time and how long cumulatively.  Second, I started watching for recompiles from time to time.  Either one of these would have led me to this issue well before that point.

This post is not about monitoring performance on a website, so, although it’s a very important thing to do, I won’t be mentioning that part again.

Monitoring Recompiles

This post is about recompiles, how they can drag you down, and how you can find out about them.  I covered how they drug me down, and in past posts I casually mentioned you should use server-side traces or XEvents to monitor them.  Then I left it up to you to figure out how.  Lets try a different approach today.

Recompiles aren’t something I’m watching for constantly, so I’m not going to run any kind of monitoring constantly for them.  What I’ll do is run an XEvent session for 24 hours and analyze what it picked up.  If it didn’t recompile often that day it almost definitely does not belong on my priority list, so this works for me.

Here’s my session.  It starts immediately, writes to five 10MB rollover files, and will not start the next time your services restart.

IF EXISTS (SELECT 1 FROM sys.server_event_sessions WHERE name = 'Recompiles')
	DROP EVENT SESSION [Recompiles] ON SERVER;
GO

CREATE EVENT SESSION [Recompiles] ON SERVER 
ADD EVENT sqlserver.sql_statement_recompile
(	SET collect_object_name=(1)
		, collect_statement=(1)
	ACTION
		(sqlserver.database_id
			, sqlserver.database_name
			, sqlserver.session_id
			, sqlserver.sql_text
			, sqlserver.username))
	ADD TARGET package0.event_file
		(SET filename=N'Recompiles'
			, max_file_size=(10)
)
WITH 
	(MAX_MEMORY=4096 KB
		, EVENT_RETENTION_MODE=ALLOW_MULTIPLE_EVENT_LOSS
		, MAX_DISPATCH_LATENCY=30 SECONDS
		, MAX_EVENT_SIZE=0 KB
		, MEMORY_PARTITION_MODE=NONE
		, TRACK_CAUSALITY=OFF
		, STARTUP_STATE=OFF)
GO

ALTER EVENT SESSION Recompiles
ON SERVER
STATE = START;

Querying the Recompiles XEvent Session

Then I’ll use this query to look at my session.  It’s a little awkward in two ways.

First, I only leave the session running for a day, but this script needs it to be running to read from it.  The only reason for that is it pulls the file path from the running sessions.  You can get around this by putting the path into the script manually.  As for me, I usually query it and figure out my next steps while it’s running, then I stop the session.

Second, and this is quite humorous to me, it recompiles due to my temp tables every time it runs.  It’s a great example of what to ignore because it’s a low-cost recompile that happens on a seldom-used ad-hoc query where performance is not a major priority.  However, because temp table definitions are cached for proc plans, this goes away if you turn this script into a proc.  I laugh every time…

When you get the results in the #Queries temp table in the end they’re what you’re used to with it just being a table and all the XML out of the way.  The query at the end of the script views them all, but I’ll play around with it doing aggregations and more.  I encourage you to do the same.  This is also why it drops the table if it exists in the beginning instead of dropping them at the end.

DECLARE 
	@SessionName SysName 
	, @TopCount Int = 1000
	
SELECT @SessionName = 'Recompile'

--SELECT @SessionName = 'system_health'
/* 
SELECT * FROM sys.traces

SELECT  Session_Name = s.name, s.blocked_event_fire_time, s.dropped_buffer_count, s.dropped_event_count, s.pending_buffers
FROM sys.dm_xe_session_targets t
	INNER JOIN sys.dm_xe_sessions s ON s.address = t.event_session_address
WHERE target_name = 'event_file'
--*/

IF OBJECT_ID('tempdb..#Events') IS NOT NULL BEGIN
	DROP TABLE #Events
END

IF OBJECT_ID('tempdb..#Queries') IS NOT NULL BEGIN
	DROP TABLE #Queries 
END

DECLARE @Target_File NVarChar(1000)
	, @Target_Dir NVarChar(1000)
	, @Target_File_WildCard NVarChar(1000)

SELECT @Target_File = CAST(t.target_data as XML).value('EventFileTarget[1]/File[1]/@name', 'NVARCHAR(256)')
FROM sys.dm_xe_session_targets t
	INNER JOIN sys.dm_xe_sessions s ON s.address = t.event_session_address
WHERE s.name = @SessionName
	AND t.target_name = 'event_file'

SELECT @Target_Dir = LEFT(@Target_File, Len(@Target_File) - CHARINDEX('\', REVERSE(@Target_File))) 

SELECT @Target_File_WildCard = @Target_Dir + '\'  + @SessionName + '_*.xel'

--SELECT @Target_File_WildCard
CREATE TABLE #Events 
(
	event_data_XML XML
)

INSERT INTO #Events 
SELECT TOP (@TopCount) CAST(event_data AS XML) AS event_data_XML
FROM sys.fn_xe_file_target_read_file(@Target_File_WildCard, null, null, null) AS F
ORDER BY File_name DESC
	, file_offset DESC 

SELECT  EventType = event_data_XML.value('(event/@name)[1]', 'varchar(50)')
	, ObjectName = event_data_XML.value ('(/event/data  [@name=''object_name'']/value)[1]', 'sysname')
	, ObjectType = event_data_XML.value ('(/event/data  [@name=''object_type'']/text)[1]', 'sysname')
	, UserName = event_data_XML.value ('(/event/action  [@name=''username'']/value)[1]', 'sysname')
	, Statement_Text = ISNULL(ISNULL(event_data_XML.value ('(/event/data  [@name=''statement'']/value)[1]', 'NVARCHAR(4000)'), event_data_XML.value ('(/event/data  [@name=''batch_text''     ]/value)[1]', 'NVARCHAR(4000)')), event_data_XML.value ('(/event/data[@name=''wait_type'']/text)[1]', 'NVARCHAR(60)'))
	, Recompile_Cause = event_data_XML.value ('(/event/data  [@name=''recompile_cause'']/text)[1]', 'sysname')
	, TimeStamp = DateAdd(Hour, DateDiff(Hour, GetUTCDate(), GetDate()) , CAST(event_data_XML.value('(event/@timestamp)[1]', 'varchar(50)') as DateTime2))
	, SPID = event_data_XML.value ('(/event/action  [@name=''session_id'']/value)[1]', 'BIGINT')
	, Database_Name = DB_Name(event_data_XML.value ('(/event/action  [@name=''database_id'']/value)[1]', 'BIGINT'))
	, EventDetails = event_data_XML 
INTO #Queries
FROM #Events

SELECT q.EventType
	, q.ObjectType
	, q.ObjectName
	, q.Statement_Text
	, q.Recompile_Cause
	, q.TimeStamp
	, q.SPID
	, q.UserName
	, q.Database_Name
	, q.EventDetails
FROM #Queries q
ORDER BY TimeStamp DESC 

Hope It Helps

Let me know how this helps.  If anything can be done to make my approach or my scripts better, I’m always open to improvement.


Database Log VLFs

Virtual Log Files (VLFs) split a physical database log file into smaller segments, which are required for how log files work in the background.  These are created automatically, but automatically doesn’t always mean perfect.  Here’s a practical view of what you need to know and how you can set them up properly.

What VLFs Do

My initial view of how a transaction log worked was that each change was written to a log file, and, as the documentation of those changes was no longer required, it was deleted from the log file.  I think this is a common way to view it, and it’s close to the truth.  However, it’s not close enough for a conversation on VLFs.

What really happens is that changes are written to the first VLF, which is just a segment of the log file.  When that VLF fills up, it moves on to the next VLF in a systematic order.

Each change made to the database is assigned a Log Sequence Number (LSN), and SQL Server keeps track of the oldest LSN it still needs for any purpose.  This purpose can be many things, but is typically the oldest LSN of the following:

  • Oldest LSN on a log backup (full or bulk-logged recovery)
  • LSN at the start of the oldest active transaction
  • LSN last replicated when using certain types of replication

Here’s my extremely complicated script to tell you what that reason is for your database:

SELECT name
	, log_reuse_wait_desc 
FROM sys.databases

If the last LSN in a VLF is older than what you need to keep, that VLF can be reused.  This makes is very efficient because this becomes something like a set-based operation for SQL Server, the entire VLF is cleared and marked for reuse at once instead of line-by-line.

To help you picture how the VLFs work, someone at Microsoft drew you a picture on Transaction Log Physical Architecture.  Then you can look at the results of DBCC LogInfo, and it will make a lot more sense when you see a VLF on each line there along with its status.

Only One Log File, Dedicated Drive

Adding more than one log file on a single database isn’t going to help your performance.  SQL Server is writing to a single VLF at a time, and that single VLF is part of a single log file.  If you have multiple log files then you’re writing to one while the other sits idle.  Once you fill up the last VLF on the first file it starts writing to the second file while the first sits idle.  If these are on separate drives that means each drive has to be able to handle the I/O, but it’s hit or miss if you’re using the I/O which leads to wasted resources and inconsistent performance.

As for how you’re writing to the log, most of the work done is writing to the tail end of it so spinning disks do really well just keeping the head in one place and writing to the file.  That is unless you have other types of files on this disk so the head writes a little to the log, jumps over to write a little to a data file, writes a bit more to the log, then jumps over to read a couple indexes.  This is a lot of where the recommendation to keep your data and log files on separate disks come from, but there is more to it than I’ll get into here.

However, we’re going to use RAID for redundancy making the drives too large for just a log, then we’ll put it on a SAN with a write cache, and do so many other things to make it more complicated.  If a server is extremely stressed and highly critical, look into dedicated spindles, SSDs, or other options.  On general shared disk arrays, it’s nice if you can have an array dedicated to just log files, even if it’s log files for multiple servers.

VLF Size Matters

When you’re writing to VLFs there can be two issues.  First, the VLFs are very small and SQL Server is jumping all over the place maintaining small files and figuring out where it should write the next entry – this is common and a big performance hit.  Second, the VLFs are too large and SQL Server is reserving a ton of space when only a small part of the tail end of the VLF is in use, then trying to clear it all at once – this is less common and less of an issue.

In addition to this, VLFs each need to be processed when restoring or recovering a database.  Recovering is part of restarting SQL services, so you should be hitting this issue at least once a month with your Windows Updates.  Every VLF adds some overhead to this process, and a huge number adds a lot of overhead to lengthen this process.

Details of this are on the Microsoft Customer Service and Support blog post How a log file structure can affect database recovery time, and it includes this eye-opening quote, “The first phase of recovering a database is called discovery where all the VLFs are scanned (in serial and single threaded fashion) before actual recovery starts.”

Are your log files pre-sized to take up the entire drive even though they only ever use 5% of that space?  Is that hurting you on recovery?

How Big Are My VLFs?

I have a script for that.  This is set to filter only logs that I want to look at, but you can comment out there WHERE clause on the final statement to see it all.  Also, it would be extremely rare for me to look at individual VLFs, so this is only looking at the sums and averages for each file.

I used to manually comment out a line on this depending on the version of SQL Server until I read a post on VLFs by Andy Galbraith (b|t) Counting Your VLFs, or, Temp Tables Inside IF…ELSE Blocks.  Thank you, Andy.  The timing of your post was perfect to help me make this easier for everyone.

CREATE TABLE #VLF_temp 
(
	RecoveryUnitID int
	, FileID varchar(3) 
	, FileSize numeric(20,0)
	, StartOffset bigint 
	, FSeqNo bigint 
	, Status char(1)
	, Parity varchar(4) 
	, CreateLSN numeric(25,0)
)

CREATE TABLE #VLF_db_total_temp
(
	DatabaseName sysname 
	, LogiFilename sysname
	, PhysFileName sysname
	, AVG_VLF_Size_MB DECIMAL(12,2)
	, vlf_count int
	, log_size_mb FLOAT
	, log_growth_mb FLOAT
)

IF (SELECT LEFT(cast(serverproperty('ProductVersion') as varchar),2)) in ('8.','9.','10') BEGIN
	ALTER TABLE #VLF_temp DROP COLUMN RecoveryUnitID
END

DECLARE db_cursor CURSOR READ_ONLY FOR 
SELECT name FROM sys.databases
WHERE State = 0

DECLARE @name sysname, @stmt varchar(40)

OPEN db_cursor

FETCH NEXT FROM db_cursor INTO @name

WHILE (@@fetch_status <> -1) BEGIN
	IF (@@fetch_status <> -2) BEGIN
		INSERT INTO #VLF_temp
		EXEC ('DBCC LOGINFO ([' + @name + ']) WITH NO_INFOMSGS')

		INSERT INTO #VLF_db_total_temp (DatabaseName, LogiFilename, PhysFileName, vlf_count, AVG_VLF_Size_MB, log_size_mb, log_growth_mb)
		SELECT DatabaseName = @name
			, LogiFilename = mf.name
			, PhysFileName = mf.physical_name
			, vlf_count = COUNT(*)
			, AVG_VLF_Size_MB = (AVG(FileSize)/1024)/1024
			, log_size_mb = (mf.size * 8)/1024 
			, log_growth_mb = CASE mf.is_percent_growth
									WHEN 1 THEN (mf.size * 8)/1024 * mf.growth/100
									WHEN 0 THEN  (mf.growth * 8)/1024 
									END
		FROM #VLF_temp vt
			INNER JOIN sys.master_files mf ON mf.database_id = db_id(@name) AND mf.file_id = vt.fileid
		GROUP BY mf.name, mf.physical_name,mf.size,mf.growth,mf.is_percent_growth;           

		TRUNCATE TABLE #VLF_temp           
	END

	FETCH NEXT FROM db_cursor INTO @name
END

CLOSE db_cursor
DEALLOCATE db_cursor

SELECT * 
	, USEDB = 'USE [' + DatabaseName + ']' 
	, CP = 'CHECKPOINT'
	, ShrinkZero = 'DBCC SHRINKFILE (N''' + LogiFileName + ''' , 0)'
	, GrowBack = 'ALTER DATABASE [' + DatabaseName + '] MODIFY FILE ( NAME = N''' + LogiFileName + ''', SIZE = ' + CAST(log_size_mb AS VARCHAR(20)) + 'MB ) --I split this up when over 10,000 MB'
	, ChangeGrowth = CASE --Note, never gets up to the 8000 MB I recommend for manual growths, but still 250 MB VLFs
						WHEN DatabaseName = 'tempdb' THEN ''
						WHEN log_size_mb <= 128 THEN 'ALTER DATABASE [' + DatabaseName + '] MODIFY FILE ( NAME = N''' + LogiFileName + ''', FILEGROWTH = 32MB )'
						WHEN log_size_mb <= 512 THEN 'ALTER DATABASE [' + DatabaseName + '] MODIFY FILE ( NAME = N''' + LogiFileName + ''', FILEGROWTH = 128MB )'
						WHEN log_size_mb <= 4000 THEN 'ALTER DATABASE [' + DatabaseName + '] MODIFY FILE ( NAME = N''' + LogiFileName + ''', FILEGROWTH = 1000MB )'
						WHEN log_size_mb <= 16000 THEN 'ALTER DATABASE [' + DatabaseName + '] MODIFY FILE ( NAME = N''' + LogiFileName + ''', FILEGROWTH = 1000MB )'
						ELSE 'ALTER DATABASE [' + DatabaseName + '] MODIFY FILE ( NAME = N''' + LogiFileName + ''', FILEGROWTH = 1000MB )'
						END
FROM #VLF_db_total_temp
WHERE (vlf_count > 50 
		AND Avg_VLF_Size_MB < vlf_count / 3) 
	OR (vlf_count > 250
		AND AVG_VLF_Size_MB < vlf_count / 2)
ORDER BY vlf_count DESC 

DROP TABLE #VLF_temp 
DROP TABLE #VLF_db_total_temp

What’s the Right Size?

The most common thing you’ll see on the internet is people talking about having too many with the limit being 1,000 VLFs and ideally at 50 VLFs.  I’m a little different and focus more on size than number.  The concept I’m going for is that excessive context switching is what causes me grief, and a reasonable size VLF will keep that under control.

Now there’s no magic number that will work noticeably better in all cases, so I won’t give you static numbers and say they’re magic.  What I can say is that too small is basically fragmentation with the overhead of context switching, too many increases recovery time, too big is huge chucks, and too few could cause extra growths as unused space is still being reserved.

It’s easy to visualize how smaller and excessive numbers of VLFs can cause issues, but that doesn’t mean huge VLFs are the way to go.  Tammy Richter Jones (b) gets into details with her post If > 50 VLFs are bad, then 16 is good, right?.  I’d love to see more on the affects of huge VLFs to have a more complete understanding if a 1 TB log file is better off with 50 20GB VLFs or 2,000 500MB VLFs.  I’m not convinced that >50 is bad.

Personally, I like formulas a lot more than static numbers, especially since they allow me to avoid extremes without stressing out.  The formulas I used broke it down into three categories:

  1. Below 50 VLFs, this is a reasonable number, they get a free ride no matter how big they are.
  2. Between 50 and 250 VLFs, the average size in MB has to be at least 1/3 of the count of VLFs.
    • For a file with 100 VLFs, the average VLF has to be over 33 MB.
  3. Over 250 VLFs, the average size in MB has to be at least 1/2 of the count of VLFs.
    • For a file with 500 VLFs, the average VLF has to be over 250 MB.

This is good enough for almost any database.  I don’t care about there being a couple small VLFs mixed in there because I’ll spend most of my time in the large ones.  I don’t care about the numbers getting larger because the average VLF is large enough to avoid too much context switching.  You’re not out to micromanage, so take a relaxed approach to this unless you have a reason to not be relaxed.

What’s Default?

Remember how I said there were no magic numbers?  Well, that doesn’t mean there aren’t wrong numbers.

By default, every database is based off of model, which has a 1 MB log files growing in 10% increments.  So 1/10th of a MB for the first growth, which is just a tiny fragment.  If you leave it this way on large databases you could end up with a 1 TB log trying to grow 100 GB at a time, which your users will notice.

Be default, you get the worst of both worlds!  The goal here is to avoid extremes, so you’ll want to change the growth rates away from the default.

How Do I Change the Size?

There’s only one way to change the size of your VLFs.  Delete them and recreate them.

For every database EXCEPT TempDB, this means shrinking the logs (it deletes VLFs to get to the size you want), then growing the logs again.  Both manual and automatic growths will split the new physical space into VLFs, but that depends on your version of SQL Server.

Here are the growth rates I pulled from Paul Randal’s post Important change to VLF creation algorithm in SQL Server 2014.

SQL 2012 and earlier uses this formula:

<= 64 MB growth is 4 VLFs

64 MB and <= 1 GB = 8 VLFs

1 GB = 16 VLFs

SQL 2014+ uses this formula:

Is the growth size less than 1/8 the size of the current log size?

Yes: create 1 new VLF equal to the growth size

No: use the formula above

So if you have too many VLFs you can shrink your log file.  It will delete VLFs that are not in use to make it smaller.  Then grow the file in increments that give you VLFs sized how you want them.  If you’re going for 500 MB VLFs then you grow your file 8,000 MB at a time.

The VLFs that weren’t deleted in this process, because they were in use or you didn’t shrink the file as far as you could have, will not be affected.  This means you’ll have different sized VLFs throughout your file, but that doesn’t really matter.  What does matter is that you don’t have any ridiculously large VLFs and you’re spending most of your time in properly sized VLFs.

Here’s how I do it.  Shrink it as much as possible.  Shrinking is never as easy as it should be, so verify it shrunk it a significant amount.  If it didn’t, take log backups and try again, repeating this process a handful of times if needed.  Then, if I want the log to be 32,000 MB, I just grow it by 8,000 MB 4 times.

--Run a log backup before this if database is not in simple and log backups run less frequently than every 5 minutes.
USE [DatabaseName]
GO
CHECKPOINT
GO
DBCC SHRINKFILE (N'LogicalFileName_Log' , 0)
GO
USE [master]
GO
ALTER DATABASE [DatabaseName] MODIFY FILE ( NAME = N'LogicalFileName_Log', SIZE = 8000MB )
ALTER DATABASE [DatabaseName] MODIFY FILE ( NAME = N'LogicalFileName_Log', SIZE = 16000MB )
ALTER DATABASE [DatabaseName] MODIFY FILE ( NAME = N'LogicalFileName_Log', SIZE = 24000MB )
ALTER DATABASE [DatabaseName] MODIFY FILE ( NAME = N'LogicalFileName_Log', SIZE = 32000MB )
GO

Assuming you were able to shrink this down to 10 VLFs remaining and you want it to be 32,000 MB, this would give you 74 VLFs with all new ones being 500 MB.  It goes over the 50 VLF limit I’ve seen elsewhere, but I’m very happy with these sizes and numbers.

With 8,000 MB growths the new 2014 calculation won’t kick in until the log was already 64,000 MB, and at that point an 8,000 MB VLF probably isn’t a bad thing.

Autogrowth Rates

I recommend manually growing larger log files between 8,000 and 16,000 MB at a time, but not autogrowths.  The process that causes a file to grow, and any other process that needs that space, will sit around and wait for an autogrowth to complete.  That could take a minute on descent disks, which is longer than many timeouts I’ve worked with.

Manually growing files is best, but almost every database will rely on autogrowth.  Know your timeouts, know how long it takes to grow a file, and size it accordingly.  I like to do 1,000 MB here, but will do as less if I have to.  If you can’t make a descent sized growth based on this, be more paranoid about manually growing files while leaving autogrowth set to smaller sizes.

The reason for 1,000 MB is that this is the largest size that will still give you 8 VLFs instead of being split into 16 VLFs, with the actual limit being at 1,024 MB.  If you did 2,000 MB, you’d still end up with 125 MB VLFs.  You can get that up to 250 MB each at 4,000 MB, but you’re telling your users to wait while 4,000 MB is zeroed out before they can move on.  Although the calculation changes for larger logs on SQL 2014, I’d still stick with 1,000 MB for a good autogrowth size.

Note, there is a resolved bug that would cause issues when log files grew in 4 GB increments, so you’ll see a lot of people using 8,000 MB instead of 8,192 MB.  We aren’t using an effected patch level anymore, but DBAs are made to be paranoid.  We’re not just lazy at math, although this doesn’t rule out that possibility.

TempDB

TempDB is different.  The database is recreated every time the SQL service restarts, so the log is recreated as well, following the formulas above.  If the log is over 1 GB, it starts out with 16 VLFs.  Jonathan Kehayias got into the details in his post TSQL Tuesday #11 – Misconceptions – The TempDB Log File and VLF Counts.

So TempDB never has too many on startup, but is this too few?  What if TempDB’s log is 40 GB, do you want a 2.5 GB VLF?  Is setting up TempDB to have 5 log files that are 8,000 MB each so it starts up with 500 MB VLFs a better idea?

Seriously, someone answer this one, I’m curious myself.

Changes Have Risk

The script above creates scripts to make changes.  It’s not perfectly safe to make those changes.  Test it, understand it, and be careful running it.

One of the most important pieces is that the scripts it generates will try to shrink the log as much as possible before growing it again.  In terms of cleaning up VLFs, this is perfect.  In terms of trying to run this during the day, it risks transactions failing because they’re trying to grab the next VLF as you’re running a shrink job to delete all unused VLFs.

You might be able to get away with this during the day most of the time, but it’s best to wait for a maintenance window to be safe.

What Others Did

Linchi Shea showed performance degradation from having too many small VLFs on Performance impact: a large number of virtual log files – Part I.  Updates can take almost 10x as long, and I would assume its due to the size and not number of VLFs.

SQLskills.com has blog posts that read like a series on this.  Kimberly Tripp wrote 8 Steps to better Transaction Log throughput, then followed that up with Transaction Log VLFs too many or too few?, which was updated to link to Paul Randal’s post Important change to VLF creation algorithm in SQL Server 2014.  All are must-reads if you want to really understand this topic.

Tony Rogerson (b|t) at the time of this writing has only put one post on his new blog, Transaction Log Concepts: Part 1.  If this is his typical quality of work, we have a lot to look forward to.  I’m personally looking forward to the other 3 parts of this 4 part series.

Grahm Kent (b|t) ran tests on the performance differences between two log files in his post Slow recovery times and slow performance due to large numbers of Virtual Log Files.  Both were 5 GB, but one was 16 VLFs (320 MB each) while the other was 20,480 VLFs (0.25 MB each).  It was good to see transaction performance as well as recovery performance covered.

Test It

If your database is absolutely critical to the point that squeezing an extra couple milliseconds of performance throughout the day would be noticed or if a server coming back online 15 seconds faster would save thousands of dollars, test it.  See how it performs in load tests and service restarts using your test servers and your database.

If you have a 1 TB log file and verified it needs to be about that big, what happens when you size it so you have 2,000 VLFs that are 500 MB each?  What happens when you have 100 VLFs that are 10 GB each?  Did it change recovery, any replication you’re doing, backup times, etc.?

Know that this can make a difference and that this is just another configuration change you can test out.  Crazy numbers on either side can be bad, and perfect numbers in the middle aren’t going to come from some stranger on the internet that never saw your server.

TempDB Excessive Memory Usage Example

I see TempDB using more memory than I feel it should and found a way to resolve it.  Previously I dove into technical details and questioning what I saw in my post TempDB Memory Leak? which is great for proving and debugging an issue.  Now I want to step back and talk about it from a practical perspective.

To keep it practical, I’m going to walk through a single server, step-by-step.  What I saw that caught my eye and how I applied my workaround.  This is a real, production server with screen shots from Idera Diagnostic Manager for both before and after comparisons.

What I’m Seeing

A large portion of my buffer pool is being utilized by TempDB pages which are unallocated on disk.  The easiest way to see this is this quick query:

SELECT Unallocated_MB = COUNT(1)/128
FROM sys.dm_os_buffer_descriptors bd
	LEFT JOIN sys.allocation_units au ON bd.allocation_unit_id = au.allocation_unit_id
WHERE bd.database_id = 2
	AND au.allocation_unit_id IS NULL

The details of everything in memory can be seen on my post Query the Buffer Pool.

Since these are all pointing to real, but unallocated TempDB pages on disk, I was able to develop a workaround of simply having fewer TempDB pages on disk.  AKA, I made TempDB data files smaller.

Sizing TempDB

Here we’re talking about being hurt by TempDB being too large, but we can’t lose sight of TempDB being too small hurting you as well.  Specifically, when your server is the busiest with a small TempDB it will have to stop and grow the files, then deal with any fragmentation that process caused.  So, while I’m not going to recommend filling your dedicated drive, I’m not going to recommend making TempDB tiny, either.

My recommendation is to monitor your server, find out how much space TempDB uses, and make your TempDB significantly larger than that.  The longer you have watched your server, the better.  The goal is still to avoid almost any growth possible, but I’m adding in a “don’t go crazy” clause.

You can do this yourself as I talked about in Monitoring Database and Table Sizes using the function call FileProperty(<filename>, ‘space used’).  If you do it this way, make sure you have this running for a minimum of several weeks at least once an hour, day and night.  It’s possible, not difficult to do, and not recommended for servers that have a reasonable monitoring system already in place.

If you’re doing this to your production servers you should already have monitoring software that’s watching file sizes for you, even if it’s only tracking this in the background with no obvious way to find the information in the GUI.  This is the situation I find myself in using Idera Diagnostic Manager.  The data’s there, but the GUI is set up for more immediate concerns.  I need this query to get what I want out of it.

SELECT TOP 100 S.InstanceName
	, DS.UTCCollectionDateTime
	, D.DatabaseName 
	, DataUsed_GB = CAST((DataSizeInKilobytes + IndexSizeInKilobytes) / 1024 / 1024.0 AS DEC(20,1)) 
	, LogUsed_GB = CAST(LogSizeInKilobytes / 1024 / 1024.0 AS DEC(20,1))
FROM SQLdmRepository.dbo.DatabaseSize DS
	INNER JOIN SQLdmRepository.dbo.SQLServerDatabaseNames D ON DS.DatabaseID = D.DatabaseID
	INNER JOIN SQLdmRepository.dbo.MonitoredSQLServers S ON S.SQLServerID = D.SQLServerID 
WHERE UPPER(S.InstanceName) = 'SERVER\INSTANCE'  
	AND D.DatabaseName = 'tempdb'
	AND UTCCollectionDateTime > GetUTCDate()-180
ORDER BY 4 DESC

My recommendation is to take the peak size outside of a one-time process and make the total TempDB data files at least 150% of that size.  If you have 4 TempDB data files and the peak size used is 4 GB, 150% of that is 6 GB, so make each file at least 1.5 GB.  Then set autogrowth to something reasonable because one-time processes will happen.

My Before Observations

All of the screen shots and trending information are from Idera Diagnostic Manger, but you should be able to get the same basic information out of any monitoring software.

I had a server with rather low PLE and a lot of physical I/O.

Server_Oversized_TempDB

The physical I/O is difficult to see here because this server has a lot of writes.  When you look closer you can see that it rather regularly went to 400 page reads per second.

PhysicalIO_Oversize_TempDB

All of those reads caused lots of waits on the server.  In my 12-hour sample period I saw a total of 34,000.  The units shown for this field are fine for comparison reasons, but they appear to be a total of the ms/s on the chart for values collected every 6 minutes, not the total waits.  You have to query the tables behind Idera Diagnostic Manager to get the real values.  In this case, the total waits were 138 minutes for shared and 49 for exclusive latches, for a total of 187 minutes of waiting for the 12 hours.

Waits_Oversize_TempDB

Just seeing this I wanted to request more memory on the VM, after all it only had 16 GB.  However, I made it a rule to never add memory without justifying what’s in memory first.  To do that, I used my query on Query the Buffer Pool, and this was the first line in the results:

Cache_Oversized_TempDB

Of the 8.5 GB of memory used by the buffer pool, about 6 GB of that was used by unallocated space in TempDB.  I can accept some because of how TempDB caches temp tables and other stuff, but to have 70% of the buffer pool used up while I’m seeing low PLE and high I/O is not acceptable.

My Fix

I had the files set to practically fill the dedicated drive according to best practices, so each of the 4 files was 7,000 MB adding up to almost 28 GB on a 30 GB drive.

Using the query in the Sizing TempDB section above, this server has never used more than 1 GB of data in TempDB at one time.  While that makes for some interesting questions on how it’s using 6 GB of cache, it does give me a lot of room to reduce the size.

There were no complaints about performance due to what this server is being used for, so I didn’t try to shrink TempDB.  Instead I took the patient approach an resized TempDB, which took effect the next time SQL Services restarted.  Then I waited for our scheduled server reboots for Windows Updates.

ALTER DATABASE [tempdb] MODIFY FILE ( NAME = N'tempdev',SIZE = 512MB , FILEGROWTH = 128MB )
ALTER DATABASE [tempdb] MODIFY FILE ( NAME = N'tempdev2',SIZE = 512MB , FILEGROWTH = 128MB )
ALTER DATABASE [tempdb] MODIFY FILE ( NAME = N'tempdev3',SIZE = 512MB , FILEGROWTH = 128MB )
ALTER DATABASE [tempdb] MODIFY FILE ( NAME = N'tempdev4',SIZE = 512MB , FILEGROWTH = 128MB )

Note that my recommendation above would have been to make the files at least 1.5 GB and I made them 2 GB here.  I’m not worried about exact numbers, I’m worried about being reasonable sizes that also avoid growths.  With peak observed usage at 1 GB and TempDB sized at 2 GB, any growths should be very rare.

Overall, the data files will grow at 512 MB at a time, which, when it happens, is large enough to avoid extreme fragmentation yet small enough to avoid extreme waits.  This should only happen during “I didn’t mean to do that” or “how’d it get that execution plan” moments, but it will happen.

My After Observations

After the change I waited a couple days to let the cache stabilize after a reboot.  We rebooted on Saturday, and all of these numbers are from the Tuesday after.

When I looked again, TempDB was using 1/10 of the space it was before for unallocated pages in memory.  It’s not perfect, but it’s much better.

Cache_RightSize_TempDB

TempDB using less cache allowed PLE be a lot more stable, regularly staying well above 2,000.  Using Jonathan Kehayias’s formula, PLE should be above 1,050 on a server with 14 GB of cache, so this is looking good.

Server_RightSize_TempDB

With data staying in cache more, physical I/O also dropped.  Before it was normal to see spikes to 400 page reads per second, now you’re seeing about half of that.

PhysicalIO_RightSize_TempDB

Less activity also meant less waits.  The couple spikes still went almost as high, but those are things you’ll fix more through tuning than memory management.  The totals at the bottom are what I’m focused on right now, the PageIOLatch_xx waits combined added up to about 11,000 for the day, so about 1/3 of what it was before.

Again, I don’t like how Idera Diagnostic Manager calculates the totals.  When I queried the tables I saw that there was 60 minutes of waits on shared latches and 13 minutes on exclusive latches, for a total of 73 minutes.  This is in comparison to 138 + 49 = 187 minutes before.

Waits_Rightsize_TempDB

The Downside

Even with the new, smaller size, TempDB is a lot larger than it needs to be so it would be very rare to see any growths in the near future.  However, I have to keep in mind that the load on my servers will always be increasing, so I may end up hitting autogrowth down the road.  Then I’ll reboot the servers each month with Windows Updates, it’ll shrink TempDB back down for me, and it will have to grow again the next month.

Because of this, I’ll need to visit every one of my servers from time to time (semi-annually?) to see if this is occurring and increase the size of TempDB if it is.  I’ll use the same script for determining the peak sizes because I have software that’s capturing that already, but I could find other methods to get that information if I needed to.

The only other downside I see is with servers that hit a high peak TempDB usage overnight then never come close to it again during the day.  This workaround won’t do much for those servers.  You need that space overnight, so trying to make the size smaller than what it needs at 2 AM will just make everything worse.  However, knowing about this will drive you nuts enough to look into the overnight processes to see if  you can lower peak usage.  Perhaps you can spread out some concurrent tasks or tune some bad queries that never mattered due to their timing.  It’s not a bad thing to do this work, it’s just that this probably wasn’t a good time for something to climb up your priority list.

Take a Look

Take a look at your servers.  How much cache is TempDB using?  Does TempDB ever even use half of the space allocated to it?  Is it causing issues on your servers?

Never make a change just because you saw someone say it’s a good idea, especially if they’ve never seen your servers before.  Look at the numbers on your servers for yourself, ask questions to understand it, and make the best decision for those specific servers.

If you do make this change, check TempDB before your next reboot.  Did it have to grow?  If it did, you need to change the size manually so it doesn’t have to hit an autogrowth every month.  If you shrunk it down to 2 GB total then it grew to 2.5 GB, consider making it 3.5 GB to avoid future growths while keeping the files reasonably sized.

If this was an issue on your servers and you feel SQL Server shouldn’t have functioned this way, please visit the Connect Item on this.  An up-vote is great, a comment or anything else is even better.


Query the Buffer Pool

DBAs are known for asking for more memory, but often can’t say what’s in memory.  While I agree that many database servers can use more memory, I’m a firm believer in knowing how you’re using your resources before asking for more.  The script below allows me to do just that.

What It Returns

This will return every index that is using at least 1 MB of memory for every database on your server.  It also returns space in memory that is associated with unallocated space in the tables which shows up as NULL for everything except the size of the space and the table name.

I’ll warn you now that the unallocated space can be surprisingly high for TempDB, and I talk about that in TempDB Memory Leak?.  Hopefully we can get a good comment thread going on that post to talk through what we’re seeing and how common the issue really is.

The Script

IF OBJECT_ID('TempDB..#BufferSummary') IS NOT NULL BEGIN
	DROP TABLE #BufferSummary
END

IF OBJECT_ID('TempDB..#BufferPool') IS NOT NULL BEGIN
	DROP TABLE #BufferPool
END

CREATE TABLE #BufferPool
(
	Cached_MB Int
	, Database_Name SysName
	, Schema_Name SysName NULL
	, Object_Name SysName NULL
	, Index_ID Int NULL
	, Index_Name SysName NULL
	, Used_MB Int NULL
	, Used_InRow_MB Int NULL
	, Row_Count BigInt NULL
)

SELECT Pages = COUNT(1)
	, allocation_unit_id
	, database_id
INTO #BufferSummary
FROM sys.dm_os_buffer_descriptors 
GROUP BY allocation_unit_id, database_id 
	
DECLARE @DateAdded SmallDateTime  
SELECT @DateAdded = GETDATE()  
  
DECLARE @SQL NVarChar(4000)  
SELECT @SQL = ' USE [?]  
INSERT INTO #BufferPool (
	Cached_MB 
	, Database_Name 
	, Schema_Name 
	, Object_Name 
	, Index_ID 
	, Index_Name 
	, Used_MB 
	, Used_InRow_MB 
	, Row_Count 
	)  
SELECT sum(bd.Pages)/128 
	, DB_Name(bd.database_id)
	, Schema_Name(o.schema_id)
	, o.name
	, p.index_id 
	, ix.Name
	, i.Used_MB
	, i.Used_InRow_MB
	, i.Row_Count     
FROM #BufferSummary AS bd 
	LEFT JOIN sys.allocation_units au ON bd.allocation_unit_id = au.allocation_unit_id
	LEFT JOIN sys.partitions p ON (au.container_id = p.hobt_id AND au.type in (1,3)) OR (au.container_id = p.partition_id and au.type = 2)
	LEFT JOIN (
		SELECT PS.object_id
			, PS.index_id 
			, Used_MB = SUM(PS.used_page_count) / 128 
			, Used_InRow_MB = SUM(PS.in_row_used_page_count) / 128
			, Used_LOB_MB = SUM(PS.lob_used_page_count) / 128
			, Reserved_MB = SUM(PS.reserved_page_count) / 128
			, Row_Count = SUM(row_count)
		FROM sys.dm_db_partition_stats PS
		GROUP BY PS.object_id
			, PS.index_id
	) i ON p.object_id = i.object_id AND p.index_id = i.index_id
	LEFT JOIN sys.indexes ix ON i.object_id = ix.object_id AND i.index_id = ix.index_id
	LEFT JOIN sys.objects o ON p.object_id = o.object_id
WHERE database_id = db_id()  
GROUP BY bd.database_id   
	, o.schema_id
	, o.name
	, p.index_id
	, ix.Name
	, i.Used_MB
	, i.Used_InRow_MB
	, i.Row_Count     
HAVING SUM(bd.pages) > 128  
ORDER BY 1 DESC;'  

EXEC sp_MSforeachdb @SQL

SELECT Cached_MB 
	, Pct_of_Cache = CAST(Cached_MB * 100.0 / SUM(Cached_MB) OVER () as Dec(20,3))
	, Pct_Index_in_Cache = CAST(Cached_MB * 100.0 / CASE Used_MB WHEN 0 THEN 0.001 ELSE Used_MB END as DEC(20,3))
	, Database_Name 
	, Schema_Name 
	, Object_Name 
	, Index_ID 
	, Index_Name 
	, Used_MB 
	, Used_InRow_MB 
	, Row_Count 
FROM #BufferPool 
ORDER BY Cached_MB DESC

Where’d the Script Come From

I’ve had a script similar to this one around for a while.  It’s originally based off of Jonathan Kehayias’s script on his post Finding What Queries in the Plan Cache Use a Specific Index, and I couldn’t have done this without having his script to start with.

Then I originally posted a version of this script on my post Cleaning Up the Buffer Pool to Increase PLE, which was great to see the index usage for a single database.  It runs slower than this, only returns a single database, and does not show unallocated space in memory.  Those changes warranted either an update to that post or a completely new post…I opted for the latter.

What It Means

Now you can see what’s in your memory. Hopefully you’ll see one or two things that stand out on here that don’t make sense; those are your easy tuning opportunities.

If an index is 100% in cache then you’re scanning on it, and that may be an issue.  Yes, you can find when you did scans on indexes using the scripts in my Indexes – Unused and Duplicates post, but it helps to have another view of what that means in your memory.

One thing the index monitoring scripts in the post I just mentioned can’t do is tell you when you’re doing large seeks as opposed to small seeks.  With the typical phone book example, you could ask for all the names in the phone book where the last names begins with anything from A to Y, giving you 98% of the phone book as results.  Index usage stats will show you did a seek, which sounds efficient.  The script on this post will show that you have 98% of your index in cache immediately after running the query, and that gives you the opportunity to find the issue.

When you see an index that looks out of place here, dive back into the scripts on Cleaning Up the Buffer Pool to Increase PLE to see what’s in cache using that index.  If the query isn’t in cache for any reason, you may be able to look at the last time the index had a scan or seek against it in sys.dm_db_index_usage_stats and compare that to results from an Extended Events session you had running to see what it could have been.

The main point is that you have something to get you started.  You have specific indexes that are in memory, and you can hunt down when and why those indexes are being used that way.  It’s not always going to be easy, but you have a start.

We’re All On a Budget

It’s not too uncommon for this process to end in asking for more memory, and I view memory like being on a budget.  The amount of memory you have right now is your current budget.  Asking for more memory should be viewed like asking for more money in a financial budget.  For a financial budget increase, here are the questions I’d be prepared to answer:

  1. What did you spend the money we already gave you on?
  2. Did you spend that money as efficiently as possible?
  3. What else do you want to spend money on?

Now you can answer these questions in database form:

  1. Here’s what I have in cache at multiple times, specifically right after PLE dropped.
  2. I went through the queries that pulled the data into cache and tuned what I could.
  3. When I checked what’s in cache multiple times, these indexes fluctuated a lot in how much was in there.  I believe adding more memory would allow them to stay in cache instead of kicking each other out to make room.

Be it Virtual or Physical environments, there’s only so much memory that can be made available to us.  We’re on budgets of how much memory the host has, how many memory slots a server has, and how large the memory chips are that those slots can handle.  Prove you’re doing it right and it’s a lot harder to say no to you.

I have an odd habit of getting the memory I ask for because I answer these questions up front in the initial request for memory.

Use Compression to Combine Data Quality and Performance

We’ve been using the wrong data types for all the wrong reasons.  DBAs, developers, data architects, etc. have all been told to keep data as narrow as possible, using the smallest data type to get the job done.  We sacrificed the integrity of our data for the performance of our data, and I’d like to thank Karen López (b|t) for pointing out that performance is NOT our #1 Job.

Disclaimer – Enterprise-ONLY

I’m talking about compression again, so I’m talking about my disclaimer again.  Compression is an Enterprise-ONLY feature that affects the structure of your data.  That means you can’t even restore a backup of your database to anything other than enterprise or developer editions unless you remove compression before the backup.

Also, this post is about maximizing the benefits of compression to reduce the costs of proper data architecture, not implementing compression blindly.  Test it on non-prod, test it again on non-prod, then only implement a documented change with a rollback plan.

Karen López Made Me Do It!

Wait a minute, it’s Lopez, not López, isn’t it?  Nope, she actually spells her name differently because there are so many programs out there that think we can get by with 26 letters in the alphabet.  To keep Karen happy (it’s in your best interest), we need to change our LastName column from VarChar(50) to NVarChar(50).  I know full well that I’m doubling the size of my data for every row, not just Karen’s, to make sure people don’t have to change their names to make me happy.

I’m wrong about half of that last sentence…. Yes, Unicode data is 2 bytes per character uncompressed while non-Unicode data is only 1 byte per character.  The key word being uncompressed, because that’s not your only option starting in SQL Server 2008 R2 (as opposed to 2008 when we got compression in general).  Look at what BOL has to say about Unicode Compression Implementation for more info on that, with the most important part being that you have to implement at least row-level compression to gain this advantage.

Now we can accommodate Karen without complaints.  After all, why should we complain?  She’s a great person to have around.

Running Out Of Numbers

Keeping up with my Karen López theme, she made a great presentation with Tom LaRock (b|t) called The Ticking Timebombs in Your Database that focused a lot on picking the right data type for identity columns.  Spoiler Alert…know your data well enough to choose either BigInt or Int for an identity column, then start with the maximum negative value for that type.

Look at your existing databases to see if you’re running out of numbers using Tom’s post SQL Server Identity Values Check.  You might find that you already have a case where there’s a 4-byte column about to hit the maximum number for an Int.  Maybe it wasn’t seeded with a big negative number, or maybe it’s because the database was just more active than it was designed for.  The important part is that this timebomb is quietly ticking down to the 3 AM phone call Tom just warned us about.

Now I’d like to stand in opposition to Karen and Tom a bit by suggesting starting a BigInt at the maximum negative value for Int.  Say you’re pretty sure an Int is big enough, but you’re not willing to bet your career on it.  However, you really like the idea of a 4-byte column as opposed to an 8-byte column.  Here’s what you do…  Make the column a BigInt (you’re not betting your career here), start it at -2,147,483,648 (maximum negative value for Int), increment by 1, and use compression.

Since the value is in the range of a 4-byte signed Int, the compressed stored value of this column will be 4 bytes.  If you happen to go over 2,147,483,647 then you keep your job (probably a good thing) and compression just loses a little of its magic when this column starts using up 8 bytes.

By the time you get to the point that the data can’t be compressed going forward, row-level compression for this single column only considering a single index only at the leaf level has saved you 16 GB.  Because it’s likely to be part of the clustered index key, it’s going to be part of all of your nonclustered indexes.  Say you have 4 nonclustered indexes on this table, each compressed giving you another 16 GB of savings.  So you saved 80 GB of disk space which is also less index space fighting for space in memory on your server.

You lose about half of your potential values when you use this method, but how much does that matter when I’d have to look up the name of my maximum value which is 9,223,372,036,854,775,807.  The important part is you avoided the extra cost of a BigInt while not failing miserably if you exceeded the maximum value of an Int.

I have kids and don’t get enough sleep as it is.  A compressed BigInt lets me sleep knowing I have both great performance and a large pool of numbers.

Why the Obsession with Karen?

Karen happens to be the perfect example.  She’s a great data architect who spells her name wrong to accommodate for not-so-great data architects.  Follow that up by her making presentations on using larger numeric data types to avoid running out of numbers.  Then I stumbled across her post about my #1 Job when I had compression on my mind, which cause me to make the correlation between compressing the data to get the performance along with the data quality.  Add to all this that she’s one of the most outspoken people (end of sentence).

It’s worth giving her (b|t) links again, with a little flare this time.  Her blog can be found at DataModel.com, and it’s a must-read for anyone creating or altering a column.  If you’re creating or altering lots of columns, then she’s a must-hire consultant.  She tweets like a bot with ADHD as @DataChick.  Unlike a bot, her tweets are pertinent and interesting…sometimes too interesting.

Just don’t ask her about her dad’s middle name, Canadian “zip codes”, the joys of air travel, or shoes.

Indexing Strategy

What do I care about when I’m playing with indexes? That’s easy. I want as few indexes as possible efficiently referenced by as many pertinent, well-tuned, consistently written queries as is reasonable. It’s explaining that last sentence that’s the hard part.

The thing that will jump out to most people is that my goal doesn’t mention a specific, single query that you want to run great.  Although that’s something I hope to achieve, it only becomes a priority as a last resort.  I’m more concerned with already having that data in memory because the index is being used by many queries, and also having fewer indexes to make data modifications more efficient. There’s more to it than that, but the detail belongs in the body of this post, not the intro.

If I was writing how to make a perfect index for a single reference to a table in a single query, this post could be done rather well in a couple paragraphs. Even though I’m focusing only on OLTP (ruling out columnstore indexes), in 99.999% of environments (ruling out in-memory hash indexes), and not getting into details of filtered indexes or indexed views, there’s still a lot to consider to the point that the first few paragraphs will just be what we’re going to keep in mind. I hope you didn’t have other plans today…

Does this advice apply to you?

It depends! Just kidding, I hate that (non) answer.

There are two targets audiences for this.  While it’s useful to everyone, you’d have to hit both of them for this to be perfect for you. First target is the person; this is written for someone who is comfortable working with indexes for single queries but wants a better view of the big picture. Second target is the database, which is a rather typical in-house OLTP database.

  • More data than you have memory
  • Writes throughout the day, especially in your larger tables
  • Read and write performance matter more than disk space
  • No extreme write loads, such as truncating and repopulating your largest table (easy fix, disable and rebuild your indexes around this action)
  • You have the ability to make indexing changes (this goes beyond what you can typically do with vendor databases)
  • Hopefully, you have the ability to make some code changes

If you or your database aren’t the perfect audience, don’t worry about it.  The most important things to know are what to keep in mind and how those things are interconnected.  The real goal is making more intelligent decisions for your databases, not fitting into a specific mold.

PreReqs!!!

Because this is an advanced look at the fundamentals of indexing strategy, you shouldn’t take offense if you have to do some prerequisite work for all of this to come together. If I give you a severe headache consider reading this stuff first, and the book on the list is well worth a second read cover-to-cover.

PreReqs:

Even with that I’ll probably still give you a headache (a common theme for me), and you’ll probably have questions. Keep in mind that some of the greatest compliments you can give someone are asking them a question and offering them large sums of cash. Although I don’t hand out my LLC’s address to send checks to unless I’ve actually looked over your indexes, I do have a free comments section below that I’d like to see used more often.

Something to consider

Here are all the things we’ll be considering. This is a great list, but nothing is ever going to be 100% all-inclusive or perfect.

Tune your queries: The ideal set of indexes for a poorly written query may be 100% different than the same query after it’s refactored.  We don’t want to constantly tinker with indexes, so this process is best if you tune your most expensive queries first.  An old, unpublished concept for this post had creating an index as a 13 step process with steps 1-11 avoiding indexes through tuning, step 12 making an index, and step 13 seeing if you could delete any other indexes.  That really wasn’t too different from Brent Ozar’s (b|t) Be Creepy method.  Indexing is not the only answer, and not the first answer either.

Query Importance: Some queries just need to complete, some need to run decently well, and some need to run as close to instantly as possible. Knowing how critical your query is will weigh in on how you index, but none of them, not even the most critical queries, will have their performance be the only deciding factor on what indexes you should have. Some outliers will require you to go back and create a specific index for them as a last resort, but there’s no reason to concern ourselves with last resorts before we get started.  If an index would work, even somewhat inefficiently, and it’ll already be in cache, do we want to create another index that will fight it for space in cache?  Don’t create another index to get your most critical query to 0.1 seconds when it’s running at 0.2 seconds and the business is happy with anything under 1.0 second.

Query Consistency: Are you querying the table the same way in all of your queries? If not, do you know you are stressing me out? Do you not care?  Using the same columns to join where possible matters, even if you could live without one of them in some cases because consistent queries mean index reusability.

Query Frequency: Some queries run five times a second, some run once a year. They aren’t even close to the same, and shouldn’t be treated the same.

Query Timing: It is different from frequency. Once-a-day is not just once-a-day. An “8-5 is critical” shop where all your users are sleeping at 3 AM means that we care much less about collateral damage from a 3 AM query. If we do a table scan on a huge clustered index at 3 AM that kicks everything out of cache it might not matter much, but do that same thing at 3 PM and we may want to consider an index even if it’s only used for a single query.

Query Justification: That query timing example threw up a red flag to me. Do we need to run that query at all? Does it need to run in prod, or is there a reporting database I can run it against? Should I consider making a reporting database? Does it need to run at 3 PM? Question the outliers that would change your indexing strategy for both if they need to run and if they could use a little T-SQL help.

Insert / Update / Delete performance: The more indexes you have, the slower your data modifications will be because they have to be written more than once. Wider indexes will be more overhead due to updates hitting it more often, larger index to maintain, and fewer rows per page of data.

Reusability: How many queries can use this index, and how will each of them use it? Is a query using it differently because it’s not referencing the table consistently or because it’s legitimately doing something different? This part is HUGE, and is really going to be a major focus. I didn’t give you a hard time on that query consistency point asking if you cared for no reason!

Memory usage: How much memory is being used, where is it being used, and why? Is that memory being used to fulfill multiple queries (see Reusability, which references Query Consistency, which goes back to Query Tuning)? Could we use less memory if we had a descent index? Is the query that requires all that memory justified and timed properly? These points are starting to mix together and reference themselves, aren’t they? Is indexing strategy an infinite loop?!?!? Yes, yes it is.

Key Lookups: For the queries that use this index, is this a covering index? If not, what would it need to be a covering index? We’ll look at these things: how critical is each query, how often is that query run, how many key lookups does it do, how wide are the total columns we would need to add to be covering, how often are each of those columns updated, what other queries would take advantage of having those columns in there, and is there any filtering being done on those columns?

Maintenance: It’s easy to see having fewer, more narrow indexes would make index rebuilds, index reorgs, and database backups quicker and easier. How about key column order and compression?

TDE: What’s this feature doing in an indexing article?

SQL Edition: Index compression is going to be the biggest one for us today. Online rebuilds can make a big difference, too, but it rarely makes a big difference in what indexes you want.

Pick a table, any table

We’re not going to change the entire database at once.  Partially because it’s overwhelming to you, but mostly because it’s lower risk that’s easier to troubleshoot and roll back if needed. So we’ll pick a single table that we want to have run more efficiently, make a change or two to it, then do it again with either the same table or a different one.

I’m not consistent on how I pick tables.  Although I usually pick one of the ones that’s the largest in the buffer pool that I haven’t made as efficient as I could already, which you can find using the query in  my Cleaning Up the Buffer Pool post.  However, that’s not always how I pick a table.  I’ll also start this off with a query that I wish was running faster, run it with SET STATISTICS IO, TIME ON to see what tables are getting hit in the slowest part, and work on a table that’s getting hit inefficiently here.  There’s no magic to it, just pick a table and reassure the other tables that they’ll get their turn later.

It looks like an infinite loop at first glance because I’ll keep picking tables and loop back to revisit table later, but it’s better to think of it as an upward spiral. That first trip around will give you all kinds of awesome, the second trip will add on to that, and each trip around yields less of an improvement. You could stop wherever you wanted if it wasn’t addictive.

Also as the size of your data changes, the queries hitting your database change, and more, it’s unreasonable to expect your indexing strategy to stay 100% the same.  This isn’t a job where you can ever say you’re really done, just in a better place than you were last week.

I have a table, now what?

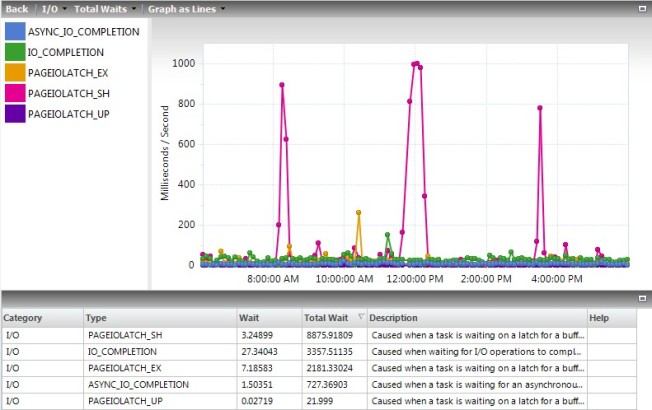
At the times of day you want your database to perform great, what’s happening with your table? This may be anything that ever runs on the database for some places, and it may be anything that runs between 8 AM and 5 PM for others.

I’m being as all inclusive as possible by looking at everything that touches the table, so this won’t be as quick and easy as you’d think. Yes, my target audience for this post can create an index for a single query in minutes while I typically spend well over an hour on a single table; how fast you make it through this project isn’t my primary concern.

Once you picked a table to work on look in the proc cache to see what references the indexes on the table.  My query to do that in the same Cleaning Up the Buffer Pool post is good for this, but the one in Querying the Plan Cache is better for viewing an entire table at once. This has every cacheable plan that ran since the last restart of services and hasn’t been forced out of memory. Remember this is a really CPU intensive query that will take several minutes to run and needs to run against prod at a time of day you care about to provide what you need. If you have an extremely busy hour or two, run this as soon as things start to calm down.

Note, there were three different ways something could have avoided you seeing it in the proc cache, and that wasn’t counting if you turned on the typically recommended setting “Optimize for ad-hoc workload” that Kimberly Tripp (b|t) wrote about where you can miss the first run of ad-hoc queries in favor of keeping your memory cleaner. It’s also possible that a query is getting a different plan each time it gets compiled due to stats changing or parameter sniffing, but that affects us a little less since we’re going to make index changes that will change those plans anyways.

The proc cache query is also only capturing index usage. It does capture RID lookups, but not table scans against a heap. You’ll have to look at the modified scripts I put in Querying the Plan Cache to see the table scans because they’re stored differently in the XML.

For now, let’s focus on how things can sneak past our cache and how we can find them.

1 & 2: Was not run since the last restart of services or was forced out of memory. It can be in cache, it’s just not there right now. For that, we’re going to check back on the cache multiple times, and we’re also going to make one or two index changes at a time which will again have us checking back multiple times.

3: Uncacheable plans can happen for several reasons, with the most popular in my experience being temp tables where data was loaded into it then an index was created on the temp table. Whatever the reason, start up extended events or a trace and watch for sql_statement_recompile to help hunt them down. Take this list and search for references of your table to know which ones are relevant. To get bonus points (I’m not keeping score), find out why it’s not getting along with your cache and see if it’s something that should be fixed.

To make things a little more difficult in that step, you’ll also have to look for references to views and functions that reference the table. The views and functions will show up in my Proc Contains Text query, and you’ll have to iterate through that process again.

Keep in mind, this will never be perfect and 100% all-inclusive. I know I said that before, but I need some of the important details repeated to me before they sink in and I have to assume there are others like me. It will be very rare for this to pick up an ad-hoc query that runs for year-end processing. You can use your imagination to find 10 other ways you’ll miss something and still be shocked when a new way pops up.

However, we have enough to move forward, and we’re going to accept the rest as acceptable risk. If you don’t accept some risk you’ll never accept any rewards, it’s just a matter of reducing the risk and knowing enough to make an intelligent decision.

Now that you know what’s running, how is each one referencing the table? Looking at the proc cache, you’ll see predicates and seek predicates, which you’ll combine on a list. You’re going to have to run the stuff that didn’t make it into the proc cache manually on a test server and add them to the list as well.

This is completely overwhelming to do all of it.  The more you do, the more accurate your results will be, but it’s not actually reasonable.  Do what’s reasonable, understand that you’re trading off some level of accuracy for time, and also understand that if you don’t make that tradeoff then you’ll never have time for anything else…not even going home at night.

Here’s what the list could use:

  • Proc or name of SQL Batch
  • How important is it
  • How often does it run
  • When does it run
  • Predicates and Seek Predicates (let’s just call them predicates)
  • Equality columns
  • Range columns
  • Inequality columns
  • Column’s returned
  • Rows returned

If there was a RID or Key Lookup on a reference to a nonclustered index, add the output columns and predicate (not the seek predicate for this case only) from the lookup on here as well.  The seek predicate on a lookup is just the clustered index key or RID bookmark added as hidden key columns on your nonclustered index; they will not help you here.

Now look at this list and look for consistencies. What equality predicates are used a lot? You should be able to find different groups of equality predicates that can accommodate most of your queries, and those are going to be the key columns you’ll consider for your indexes. The first key column is going to be the column all of the queries you want to use this index have in common as an equality column, then iterate through them as the columns are used less and less.

This is not the traditional “order of cardinality” advice I’m sure you’ve heard when creating an index for a specific query, but we’re designing an index for your database, not your query. I’ll go one step further and say if it’s a toss-up between what’s the first key column, consider making it one that’s added sequentially such as DateAdded or ID on tables that see more updates because that will reduce page splits and fragmentation.

A query can take advantage of the chain of key columns starting with the first one. The chain can continue after each equality use. An inequality or range can take advantage of a key column as well, but the first one of these is the end of your chain. Once the chain is broken, everything else can be useful, but only as unordered values that don’t matter if they’re key columns or included columns.

You can stop putting in key columns when either queries stop being able to take advantage of them being ordered or the values you’re getting are either unique or close enough. These key columns aren’t free as Paul Randal (b|t) points out in his post On index key size, index depth, and performance.  If a key column is not very useful, then it’s very useful not to have it there.

I should note that if you’re using an index to enforce uniqueness then it will use all the key columns and none of the included columns to do so.  Based on the last paragraph you don’t want any key columns after it’s unique anyways, so don’t even consider that.  However, included columns aren’t used to calculate uniqueness, so you can make this a covering index if it helps you without hurting the unique constraint.

This process, like any other indexing process, isn’t going to be perfect. You’ll have to weigh your decisions with queries that are more critical or are called more often carry more weight in your decision.

Now that you have your key columns figured out, look at the queries that use more than just those columns. When they reference this index how many rows are they going to return where they have to get more information from the table itself through a lookup? How wide are those columns, and how many other queries are going to do the same? This is the balancing act between adding included columns and accepting key lookups. A key lookup is going to be a nested loop operation making separate calls to get the missing columns from the clustered index (or heap, for those who wish to anger me), so 10,000 key lookups is 10,000 separate calls in a loop. If you have to add a large number of columns to eliminate 10 key lookups then it’s almost never worth it. If you have to add one small column to eliminate 1,000,000 key lookups then it’s almost always worth it. Notice I didn’t use determinate language on those…you’ll have to find your balance, test it, and balance it again.

Some things like adding a column to avoid key lookups may make more of a difference to you than the user, but that doesn’t make it less important. For instance, I just said adding a small column to eliminate 1,000,000 key lookups is almost always worth it. If those 1,000,000 key lookups were from a single execution of a query then the user would probably notice, they might even buy you lunch if you’re lucky. If it was a single key lookup on a query run 1,000,000 times that day it’s still a drop in CPU utilization and a potential 1,000,000 pages from the clustered index that didn’t have to be read into cache. You’re doing this because it adds up to a better running server, not always because it’s noticed.

Your goal here is making an index as reusable as is reasonable. Here are the reasons you’re doing that:

  • Every index will fight to be in cache (assuming you don’t have vastly more memory than databases to fill it), an index that is reusable by many queries will be more likely to already be in cache and that space in cache will be more versatile.
  • Every index is another write process in an Insert, Update, and Delete, you’re trying to cut down on those.
  • Every index needs to be maintained, you’re cutting down on that, too.
  • Every index adds disk space, backup size, backup duration, restore durations, etc..
  • If you use TDE, every time a page is read from disk into memory it is decrypted. A reusable index tends to stay in memory more, reducing the number of times the CPU has to decrypt it. See, I TOLD you this belonged in an indexing strategy post!

Nothing’s free, so here’s what you’re giving up:

  • The index isn’t going to be the prefect index for most queries. Test the performance of your critical queries, but also keep in mind that these indexes are more likely to be in cache which could eliminate physical reads from the execution of those queries.
  • These indexes will tend to be wider than the query needs, which is basically restating that this isn’t going to be the perfect, most efficient index for a query. It also means that physical reads on these indexes will tend to be more expensive as there are fewer rows per page.  Again, keep in mind they’re more likely to be in memory because you’re going with fewer indexes that are shared by more queries.

Once you decide on an index or two to add, there are a couple things to consider.

  • What indexes don’t you want anymore? If a query could use another index slightly more efficiently, it will.  However, if it’s close enough then you want to get rid of that other index because of all those benefits of reusability I just mentioned (weren’t you paying attention?). It’s not a question of if a query would use the other index, it’s a question of if you want it to use it.
  • Some queries “should” use this index based on the key columns, but instead of it showing up as a seek predicate it shows up as a predicate. In these cases either your chain of key columns was broken (if column 2 wasn’t an equality column, column 3 will not be a seek predicate) or this column is not being referenced in a SARGable way.
  • Test in non-prod, not prod. Then test it again.
  • Know you’re accepting risk and understand everything involved the best you can. Have a healthy fear of that risk while also understanding that you took a risk just driving to work this morning.

Once these changes go through keep an eye on how they’re being used over the next couple weeks. If you’re in a rush to make a big impact, start a second table as the first change or two are in progress on the first table. Just don’t get too many changes in motion for a single table at once as that’s typically adding more risk and hiding which changes had positive and negative impacts. This is a process, and the longer it takes you do go through it the better the chance is that you’re doing it right.

If I’m doing this process for someone else who wants consistent improvement without taking on too much time or risk at once, then I like to get on their servers once or twice a month, find one or two changes to suggest, then have those go through testing and implementation.  Afterwards review the results and come up with the next suggestion.  It’s hard to be that patient as a full-time employee, but try.

Cluster It

All of that was talking about nonclustered indexes, but you get to pick a clustered index for your table as well.  Keep in mind this is a bigger change and involves more risk, but it’s also a bigger reward.

So, what do I care about that’s special for a clustered index?

  • Uniqueness
  • Key width
  • Width of columns being queried
  • Column types being returned (some can’t be in nonclustered indexes)
  • Number of rows being returned

The size of your key columns on your clustered index is the MINIMUM size of the key columns on a nonunique nonclustered index, and it’s also the MINIMUM width of the page level of any nonclustered index.  You need to keep that in mind.

However, just because your table has an identity column in it doesn’t mean that’s the best clustered index.  What is the best clustered index is going to vary wildly from table to table; there’s not always going to be a clear answer, and the answer will partially depend on how the table is queried.  I get into that a lot more in my last post, Picking a Clustered Index.  Yes, I wrote that post specifically to keep this one shorter…with mixed results.

If a table is often queried by a relatively small column that’s not unique, but the queries tend to pull back most of the columns in the table and a large number of rows then it’s worth considering using this as part of the clustered index key.

If you don’t then you’re faced with two solutions; you can make a really wide nonclustered index to cover these queries, or you can let the queries decide if they want to do a ton of key lookups or just scan the clustered index.  These don’t sound like fun to me.

You still have to worry about the integrity of your data, so if you’re dropping the unique clustered index with a single column to do this then you almost definitely want to add a unique nonclustered index with that single key column to maintain your data integrity.

Compress It

Index compression is an Enterprise-ONLY feature.

Compression is a very big point to hit on here, even if I’m only giving you the compressed version.  It makes your data smaller on disk (less I/O), smaller in memory (less need for I/O), and actually tends to lower your CPU usage instead of raising it.  I get into a lot more detail in my Data Compression post because I didn’t want to have too much space dedicated to a feature not everyone can use here.

Don’t Forget the Outliers

Go back to that list you made of all the queries hitting a specific table. Were some of the queries different than the rest? There are usually a couple, and that doesn’t necessarily mean there’s an issue. However, I look at these to determine if they are using the table properly.

Are they are joining on all the fields they should be. Sometimes you can get the correct results by joining on 3 of the 4 fields you technically should, so why join on the 4th? Well, index reusability is one of those reasons, because it may not be able to use the proper index because someone skipped a column that happens to be the first key field of the perfect index for this query.

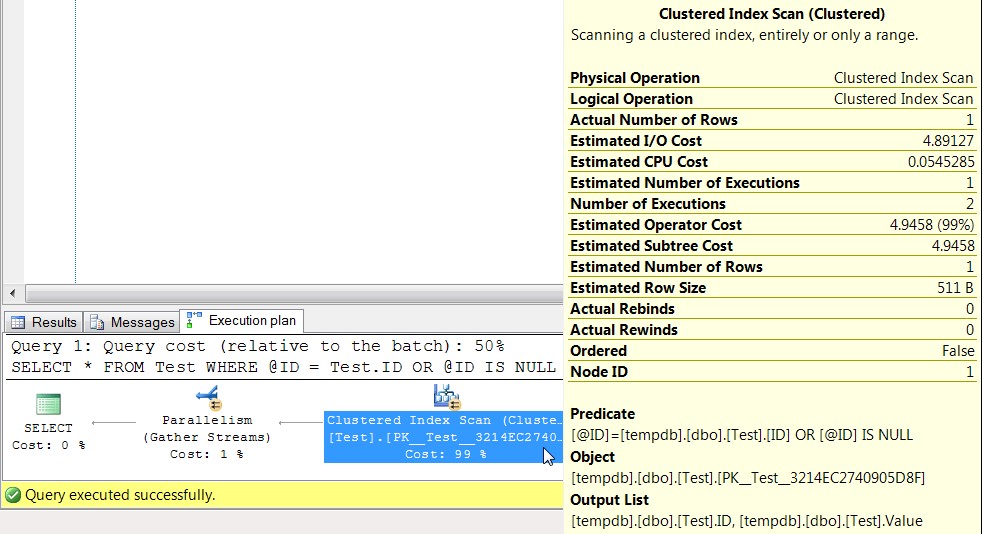
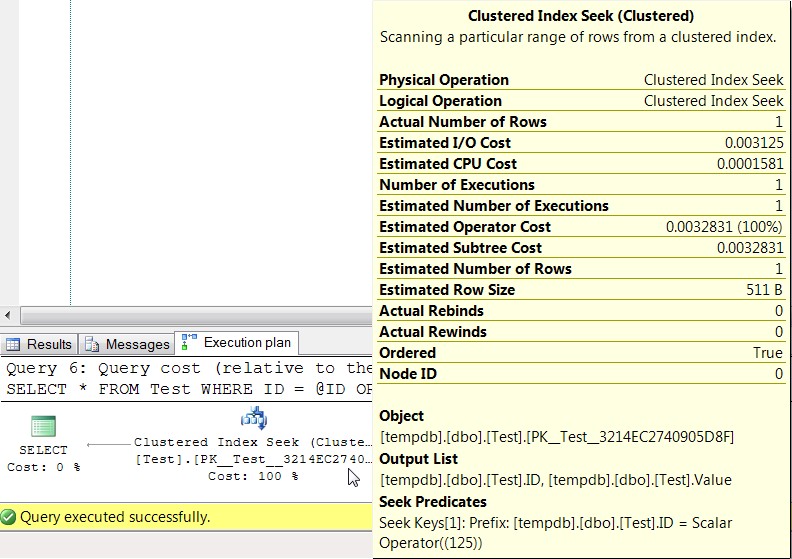
Is the query SARGable? Sometimes you’re joining or filtering on the right fields, but something is written in a way that SQL couldn’t do a direct comparison.

Are you returning too many columns? I’ve seen queries returning 20 columns (or using *, which is a move obvious version of the same thing) to populate a screen that uses 3 of them, and on the SQL side you have a DBA trying to figure out if they should add included columns to an index to make that run more efficiently. The most efficient for this and many other examples is refactoring, not reindexing.

Remember, your goal is to make your server run more efficiently, and tweaking indexes is simply one of your tools. While you’re going through this process keep your eyes open towards how other tools can be used.  SSMS is never going to come up with a warning telling you that you should read a book or two by Itzik Ben-Gan (b|t) or Kalen Delaney (b|t), but I would welcome that change.

Does this negate my previous advice?

If you follow my blog at all, which is suggested in my very biased opinion, you may have seen me talk about Unused and Duplicate Indexes, but I make no mention of them here. Did I forget about them?

No, I did not. This is designing every index you want to have on your table in a reusable way. If that index was not on the list then you’ll want to consider getting rid of it. It’s two ways of looking at the same thing. A complete understanding of both of these methods will help you make intelligent indexing decisions and go as far as you need to for the situation you’re in.

Talk to me

This isn’t a short or easy process, and perhaps I could have worded some of it better.  I enjoy what I do, both writing this post and playing with indexes, and having someone think enough of me to ask me questions on this makes it all the more enjoyable.

I may be rewriting parts of this post as I find ways to reword concepts better, especially as I finalize and tweak my presentation with the same name for which this post is my guide. That presentation will make its debut at SQL Saturday Cleveland on February 6, 2016.

If you feel you can help me improve, please don’t hold back.  I’d rather feel that I’m improving than falsely believe I’m infallible.

Data Compression

Data compression is often misunderstood to cost CPU in exchange for smaller size on disk.  Somewhat true, but that simple explanation ignores other savings that often result in net drop in CPU utilization.

Full disclosure: This is an Enterprise-ONLY feature introduced in SQL 2008.  It is engrained in the structure of your data, so it also means you can’t take a backup of a database that has a compressed index and restore it to anything other than Enterprise or Developer Editions.

Here are the simple facts we’ll play with:

  • Two levels – row-level and page-level
  • Page-level is row-level plus extra compression
  • Compression ratios vary by column types, index width, and data
  • Data is compressed both on disk and in memory
  • CPU goes both ways, and it needs to be tested
    • Uses CPU to compress on writes and index maintenance
    • Uses CPU to decompress when used by a query
    • Saves CPU with fewer physical reads
    • Saves CPU with fewer logical reads
    • And more…

Abstract Thought

This post is at a level of abstraction that doesn’t get into what happens in the background.  My goal is to encourage you to test it out, understand why it helps, and be able to explain that in your change control process.

For those of you who aren’t satisfied with my “Gas pedal make car go fast” explanation, Jes Borland (b|bob|t) wrote A Look Inside SQL Server Row and Page Compression, and Brad McGehee (b|t) wrote A Quick Introduction to Data Compression in SQL Server 2008.

You can even dive into more details such as using different levels of compression on each partition of an index, or even talking to Joey D’Antoni (b|t) about the archival levels of compression on columnstore indexes.

There’s a lot of detail on how compression can cost CPU, but the details that save CPU are typically only mentioned in passing without doing a deep dive into the topic.  Data Compression: Strategy, Capacity Planning and Best Practices mentions that less Logical I/O is less to consume CPU.  SQL Server Database Compression is indirectly mentioning having a smaller B+Tree structure.

The purpose of this post isn’t to earn anyone a doctorate (or claim that I’m at that level), it’s more of a practitioner level.

What’s it do?

Each page is the same 8kb size but contains more data per page, as per Captain Obvious.  This means less space on disk and backups.  Those are nice, but I don’t care too much about that.

Then you read the data into memory so queries can use it.  This is a physical I/O to disk that goes through the CPU (using extra CPU to decrypt it if you use TDE) to make it into memory.  It stays compressed when in memory, so all of your indexes (not just this one) have more room to hang around and avoid more physical I/Os and the costs I just mentioned.

Finally, a query needs to use the data, and that has positives (+) and negatives (-).  The data is more likely to be in cache (+) because it’s smaller and a page with more data is more likely to be referenced. It’s easier to get into cache if it wasn’t there already (+). Then it’s easier to get to the data because the smaller data may have fewer levels in the B+Tree (+). Along the way it has to decompress the root and intermediate level pages (-) which are always row-level compressed when you use any level of compression then decompress the leaf-level pages (-) which are compressed at the level you picked.  However, there are fewer pages, which results in less Logical I/O (+).

You’re not going to accurately figure out the positives and negatives of that last paragraph.  The important part is that you know there are positives AND negatives, which means you put away the calculus and just run some tests.

My experience is that if the data is compressed by 25% or more than it helps more than it hurts.  Find how much you’ll save by running sp_estimate_data_compression_savings for both row-level and page-level compression.  If you don’t get much extra compression with page-level then don’t even test it, it’s an added expense that needs to be justified.

What Compresses Well?

The hard way is to analyze each column, its data type, the data in that column, the width of the index, etc..  You can read the links in the Abstract Thought section to see what Brad and Jes have to say about it if you want.  This will be very important if you’re designing tables and keeping how compressible the data is in mind, but less so if you’re compressing already existing indexes.

The easy way (my personal favorite) is to just run sp_estimate_data_compression_savings I just mentioned and actually compress the indexes on a non-prod server.  Computers are good at math, let them do it.

How to Test

I’m not diving deep into testing here, but there are three things that stand out.

  • How much memory are you saving?
  • How do your queries perform?
  • How much faster is the data pulled from disk?

For how much memory you would save, look at my Cleaning Up the Buffer Pool post to see how much memory that index is using.  Since you’re only changing how much space the data takes and not the columns of the indexes here, you can just multiply that by the new compression ratio.  Use the actual ratio comparing the index size in prod to where you’re testing in non-prod to make sure it’s accurate.  Yes, if you have a 10 GB index which tends to be 100% in cache that you just compressed 80%, it will be like you added 8 GB of memory in many ways.

I do query performance and how much faster the data is pulled from disk together, because that’s how it’s done in the real world.  Pick your queries that hit that index, typically by looking in the plan cache or an XEvent session.  Then, on a non-prod server, run the queries both with and without DBCC DROPCLEANBUFFERS, again, on a non-prod server.

You can remove compression on any index, down to the partition level, by doing ALTER INDEX … REBUILD WITH (DATA_COMPRESSION = NONE).  Adding compression is the same statement with ROW or PAGE instead of NONE.

Sum It Up

Do this all in non-prod.

  1. See what compresses well
  2. Test it
  3. Test it again

The End

Let’s hear from you.  If you needed more data to make an informed choice, throw it in the comments where others can benefit from your experience, and I may even edit the post to add it in.  Also, if this is making a big difference for a lot of people, I’ll do what I can to tweak the SEO and help more people find this through search engines.

The best compliment is a question.  It means you value my expertise enough to want my thoughts and opinions.

Querying the Plan Cache

I love working with indexes, and I need to know what’s using them to work on them intelligently. Most of that information is already there waiting for you to query it. Luckily, Jonathan Kehayias (b|t) did the hard work for us in his post Finding what queries in the plan cache use a specific index, and I could modify his code to get entire tables.

Remember that you’re querying XML and that’s a CPU intensive process. However, you’re also looking for what’s in cache which is most relevant during or just after your busiest time of day on prod. The longer you wait, the more chance a query will be flushed from cache for one reason or another, although waiting a couple hours typically isn’t a problem on a server that’s not under extreme stress.

This first script will find all references to the indexes of a table in the plan cache, including key and RID lookups. However, table scans against heaps are in the XML a little different, and that’s what my second query is for. Hopefully you have a clustered index on every table you want to run this against, but you’ll probably need both of these.

If you’re only looking for a single index in the cache, I already have that query on my Cleaning up the buffer pool post. However, I’m working on some new stuff that’s way too long to put scripts in-line, so I had to create this post to add as a reference. I’ll try to remember to update this post as I have everything done, but keep an eye out for my “Indexing Strategy” post and my presentation by the same name I hope to debut at the Cleveland SQL Saturday in February 2016.

Table Index Usage

SET TRANSACTION ISOLATION LEVEL READ UNCOMMITTED;
DECLARE @TableName SYSNAME = '[ShiverMeTuples]'; 
DECLARE @DatabaseName SYSNAME;
 
SELECT @DatabaseName = '[' + DB_NAME() + ']';
 
WITH XMLNAMESPACES
   (DEFAULT 'http://schemas.microsoft.com/sqlserver/2004/07/showplan')
SELECT
    n.value('(@StatementText)[1]', 'VARCHAR(4000)') AS sql_text,
    --n.query('.'),
    cp.plan_handle,
    i.value('(@PhysicalOp)[1]', 'VARCHAR(128)') AS PhysicalOp,
    i.value('(@EstimateRows)[1]', 'VARCHAR(128)') AS EstimateRows,
    i.value('(@EstimateIO)[1]', 'VARCHAR(128)') AS EstimateIO,
    i.value('(@EstimateCPU)[1]', 'VARCHAR(128)') AS EstimateCPU,
	cp.usecounts,
    i.value('(./IndexScan/@Lookup)[1]', 'VARCHAR(128)') AS IsLookup,
    i.value('(./IndexScan/Object/@Database)[1]', 'VARCHAR(128)') AS DatabaseName,
    i.value('(./IndexScan/Object/@Schema)[1]', 'VARCHAR(128)') AS SchemaName,
    i.value('(./IndexScan/Object/@Table)[1]', 'VARCHAR(128)') AS TableName,
    i.value('(./IndexScan/Object/@Index)[1]', 'VARCHAR(128)') as IndexName,
    --i.query('.'),
    STUFF((SELECT DISTINCT ', ' + cg.value('(@Column)[1]', 'VARCHAR(128)')
       FROM i.nodes('./OutputList/ColumnReference') AS t(cg)
       FOR  XML PATH('')),1,2,'') AS output_columns,
    STUFF((SELECT DISTINCT ', ' + cg.value('(@Column)[1]', 'VARCHAR(128)')
       FROM i.nodes('./IndexScan/SeekPredicates/SeekPredicateNew//ColumnReference') AS t(cg)
       FOR  XML PATH('')),1,2,'') AS seek_columns,
    RIGHT(i.value('(./IndexScan/Predicate/ScalarOperator/@ScalarString)[1]', 'VARCHAR(4000)'), len(i.value('(./IndexScan/Predicate/ScalarOperator/@ScalarString)[1]', 'VARCHAR(4000)')) - charindex('.', i.value('(./IndexScan/Predicate/ScalarOperator/@ScalarString)[1]', 'VARCHAR(4000)'))) as Predicate,
    query_plan
FROM (  SELECT plan_handle, query_plan
        FROM (  SELECT DISTINCT plan_handle
                FROM sys.dm_exec_query_stats WITH(NOLOCK)) AS qs
        OUTER APPLY sys.dm_exec_query_plan(qs.plan_handle) tp
      ) as tab (plan_handle, query_plan)
INNER JOIN sys.dm_exec_cached_plans AS cp 
    ON tab.plan_handle = cp.plan_handle
CROSS APPLY query_plan.nodes('/ShowPlanXML/BatchSequence/Batch/Statements/*') AS q(n)
CROSS APPLY n.nodes('.//RelOp[IndexScan/Object[@Table=sql:variable("@TableName") and @Database=sql:variable("@DatabaseName")]]' ) as s(i)
--WHERE i.value('(./IndexScan/@Lookup)[1]', 'VARCHAR(128)') = 1
ORDER BY 3 
OPTION(RECOMPILE, MAXDOP 4);

Table (Heap) Scans

SET TRANSACTION ISOLATION LEVEL READ UNCOMMITTED;
DECLARE @TableName SYSNAME = '[ItsAHeapOfSomething]'; 
DECLARE @DatabaseName SYSNAME;
 
SELECT @DatabaseName = '[' + DB_NAME() + ']';
 
WITH XMLNAMESPACES
   (DEFAULT 'http://schemas.microsoft.com/sqlserver/2004/07/showplan')
SELECT
    n.value('(@StatementText)[1]', 'VARCHAR(4000)') AS sql_text,
    n.query('.'),
    cp.plan_handle,
    i.value('(@PhysicalOp)[1]', 'VARCHAR(128)') AS PhysicalOp,
    i.value('(./TableScan/@Lookup)[1]', 'VARCHAR(128)') AS IsLookup,
    i.value('(./TableScan/Object/@Database)[1]', 'VARCHAR(128)') AS DatabaseName,
    i.value('(./TableScan/Object/@Schema)[1]', 'VARCHAR(128)') AS SchemaName,
    i.value('(./TableScan/Object/@Table)[1]', 'VARCHAR(128)') AS TableName,
    --i.value('(./TableScan/Object/@Table)[1]', 'VARCHAR(128)') as TableName,
    i.query('.'),
    STUFF((SELECT DISTINCT ', ' + cg.value('(@Column)[1]', 'VARCHAR(128)')
       FROM i.nodes('./OutputList/ColumnReference') AS t(cg)
       FOR  XML PATH('')),1,2,'') AS output_columns,
    STUFF((SELECT DISTINCT ', ' + cg.value('(@Column)[1]', 'VARCHAR(128)')
       FROM i.nodes('./TableScan/SeekPredicates/SeekPredicateNew//ColumnReference') AS t(cg)
       FOR  XML PATH('')),1,2,'') AS seek_columns,
    RIGHT(i.value('(./TableScan/Predicate/ScalarOperator/@ScalarString)[1]', 'VARCHAR(4000)'), len(i.value('(./TableScan/Predicate/ScalarOperator/@ScalarString)[1]', 'VARCHAR(4000)')) - charIndex('.', i.value('(./TableScan/Predicate/ScalarOperator/@ScalarString)[1]', 'VARCHAR(4000)'))) as Predicate,
	cp.usecounts,
    query_plan
FROM (  SELECT plan_handle, query_plan
        FROM (  SELECT DISTINCT plan_handle
                FROM sys.dm_exec_query_stats WITH(NOLOCK)) AS qs
        OUTER APPLY sys.dm_exec_query_plan(qs.plan_handle) tp
      ) as tab (plan_handle, query_plan)
INNER JOIN sys.dm_exec_cached_plans AS cp 
    ON tab.plan_handle = cp.plan_handle
CROSS APPLY query_plan.nodes('/ShowPlanXML/BatchSequence/Batch/Statements/*') AS q(n)
CROSS APPLY n.nodes('.//RelOp[TableScan/Object[@Table=sql:variable("@TableName") and @Database=sql:variable("@DatabaseName")]]' ) as s(i)
--WHERE i.value('(./TableScan/@Lookup)[1]', 'VARCHAR(128)') = 1
OPTION(RECOMPILE, MAXDOP 4);

Extended Events Intro

Extended Events is supposed to be taking over for most of Profiler and server-side tracing functionality, but there were people like me out there that took their time making the switch. For me the excuse was SQL Batch Completed isn’t in 2008 / 2008 R2, most databases are slow to move off of 2008 because it’s hard to say 2008 can’t do everything you want, and, well, I really like SQL Batch Completed!!!

Now I’m losing my excuses. It’s been three years since 2012 came out and all the new servers I’m installing are 2012 or 2014, so I lost that excuse. Then I came up with “I don’t know how to use them, but I know how to use something that does almost the same thing”; that’s great logic during an outage, but terrible logic for the long term. So, I’m learning it, still learning it, and I have something to help out those who made it to 2012 but are still stuck on the “I don’t know how to use them” phase of denial.

In several of my blog posts I referenced my favorite server-side trace. Capture everything on the server that takes over X seconds, with 5 being my favorite starting place. Yes, this adds about 1ms to anything that takes over 5 seconds, which adds up to…insignificant. Seriously, if this kills your server then it was dead already, but you will see arguments against creating this for long-term runs.  I don’t agree with those arguments, but they’re your servers and I want you to make an informed decision on what you run.

Anyways, here’s how I set it up with Extended Events, for which I used Jonathan Kehayias’s (b|t) Trace to XE Converter to get started.

IF EXISTS (SELECT 1 FROM sys.server_event_sessions WHERE name = 'DurationOver5Sec')
	DROP EVENT SESSION [DurationOver5Sec] ON SERVER;
GO
CREATE EVENT SESSION [DurationOver5Sec]
ON SERVER
ADD EVENT sqlserver.rpc_completed(
	ACTION 
	(
		  sqlserver.client_app_name	-- ApplicationName from SQLTrace
		, sqlserver.client_hostname	-- HostName from SQLTrace
		, sqlserver.client_pid	-- ClientProcessID from SQLTrace
		, sqlserver.database_id	-- DatabaseID from SQLTrace
		, sqlserver.request_id	-- RequestID from SQLTrace
		, sqlserver.server_principal_name	-- LoginName from SQLTrace
		, sqlserver.session_id	-- SPID from SQLTrace
	)
	WHERE 
	(
			duration >= 5000000
	)
),
ADD EVENT sqlserver.sql_batch_completed(
	ACTION 
	(
		  sqlserver.client_app_name	-- ApplicationName from SQLTrace
		, sqlserver.client_hostname	-- HostName from SQLTrace
		, sqlserver.client_pid	-- ClientProcessID from SQLTrace
		, sqlserver.database_id	-- DatabaseID from SQLTrace
		, sqlserver.request_id	-- RequestID from SQLTrace
		, sqlserver.server_principal_name	-- LoginName from SQLTrace
		, sqlserver.session_id	-- SPID from SQLTrace
	)
	WHERE 
	(
		duration >= 5000000
	)
),
ADD EVENT sqlos.wait_info(
	ACTION 
	(
		  sqlserver.client_app_name	-- ApplicationName from SQLTrace
		, sqlserver.client_hostname	-- HostName from SQLTrace
		, sqlserver.client_pid	-- ClientProcessID from SQLTrace
		, sqlserver.database_id	-- DatabaseID from SQLTrace
		, sqlserver.request_id	-- RequestID from SQLTrace
		, sqlserver.server_principal_name	-- LoginName from SQLTrace
		, sqlserver.session_id	-- SPID from SQLTrace
	)
	WHERE
	(
		duration > 5000 --This one is in milliseconds, and I'm not happy about that
            AND ((wait_type > 0 AND wait_type < 22) -- LCK_ waits
                    OR (wait_type > 31 AND wait_type < 38) -- LATCH_ waits
                    OR (wait_type > 47 AND wait_type < 54) -- PAGELATCH_ waits
                    OR (wait_type > 63 AND wait_type < 70) -- PAGEIOLATCH_ waits
                    OR (wait_type > 96 AND wait_type < 100) -- IO (Disk/Network) waits
                    OR (wait_type = 107) -- RESOURCE_SEMAPHORE waits
                    OR (wait_type = 113) -- SOS_WORKER waits
                    OR (wait_type = 120) -- SOS_SCHEDULER_YIELD waits
                    OR (wait_type = 178) -- WRITELOG waits
                    OR (wait_type > 174 AND wait_type < 177) -- FCB_REPLICA_ waits
                    OR (wait_type = 186) -- CMEMTHREAD waits
                    OR (wait_type = 187) -- CXPACKET waits
                    OR (wait_type = 207) -- TRACEWRITE waits
                    OR (wait_type = 269) -- RESOURCE_SEMAPHORE_MUTEX waits
                    OR (wait_type = 283) -- RESOURCE_SEMAPHORE_QUERY_COMPILE waits
                    OR (wait_type = 284) -- RESOURCE_SEMAPHORE_SMALL_QUERY waits
	--OR (wait_type = 195) -- WAITFOR
                )
	)
)
ADD TARGET package0.event_file
(
	SET filename = 'DurationOver5Sec.xel',
		max_file_size = 10,
		max_rollover_files = 5
)
WITH 
(
	MAX_MEMORY = 10MB
	, MAX_EVENT_SIZE = 10MB
	, STARTUP_STATE = ON
	, MAX_DISPATCH_LATENCY = 5 SECONDS
	, EVENT_RETENTION_MODE = ALLOW_MULTIPLE_EVENT_LOSS
);

ALTER EVENT SESSION DurationOver5Sec
ON SERVER
STATE = START;
	

What’s it all mean?

This captures all SQL Batch Completed and RPC Completed events that took over 5 seconds along with any waits that took over 5 seconds. Seems kind simple and much easier to read than the script to create a trace, but there are some things to point out here.

  • Duration – Milliseconds or Microseconds
  • File Location
  • Restart on server reboot

First, duration, is it milliseconds or microseconds? Trick question, it’s both!!! Ola Hallengren (b|t) opened This Connect Item which resulted in Microsoft apologizing and saying they’ll fix it in SQL 2016. They can “fix” it one of two ways. Either they’ll document them as being different scales and your script will still work without any modifications, or they’ll make them all be the same scale and the script I have here will behave differently on different versions of SQL Server. Anyways, the script I have here is 5 seconds all around, which is 5,000,000 microseconds for the SQL and 5,000 milliseconds for the waits.

Continuing on the duration confusion, the wait info’s duration still isn’t what you might think it is.  This is the duration for a single instance of a wait, not cumulative waits for the duration of a specific query or batch.  If you made a loop that executed 10 times calling a wait for delay of 1 second each time then those are 10 separate 1 second waits.  More important, if your query is doing physical reads from disk then it’s a ton of small PageIOLatch waits, not one large one this session will see.  I understand why it has to be this way, but understanding and enjoying are two different things.

The rest of this isn’t nearly as confusing, I promise.

The file location I’m using is just a filename without a path, which will default to where your error log files are. It’s going to be a much more complex name once SQL Server is done with it, and not just a underscore with a rollover count like server-side traces.  However, it will start how it’s written here and you can use wildcards to say which files you want to read.

Now when you restarted the server, or just SQL services, with server-side traces you’d have to manually start that trace again if you wanted it to run all the time. This is exactly how the script I have here works, too. However, Extended Events also added “Startup State” which means it will start when the server starts. The only issue I have with this is that it will ONLY automatically start when the services start. That’s all fine and good if you’re a patient person….it’s not all fine and good for me, so I manually start it when it’s created.

The other minor details I can see having questions on are on the Max Dispatch Latency and Event Retention Mode. These are limits on how it writes to the file location I’m using. Max Dispatch means that SQL Server will write it to the output file within that many seconds after the event actually happens, so it’s obviously an asynchronous action. Event Retention Mode can give SQL Server permission to say it’s too overworked to write the entries and skip them if needed, and I chose to tell SQL Server to drop as many as it wants to if I’d be slowing it down.  It’s all documented in BOL, and it’d be good for you to read through that instead of just listening to me picking out select details.

So, how do you read this? It’s going to put it all in XML, isn’t it!?!?

If you can read this, Kendra Little (b|t) may suggest you’re a demon robot! (While her comment makes me laugh, that post is a great XE reference or it wouldn’t be on here.) Well, she’s probably right in calling this next script names because friendly robots don’t treat your CPU like this. In fact, if you’re on a stressed server or want to do a lot of analysis on this, it’s going to be best to copy the .xel files to a server you care a little less about and shred the XML there.

Unfortunately, I wrote my script to automatically find the files and add a wildcard character, so you’d have to modify my script to run it on another server. The point is getting you started with as little frustration as possible, and this is perfect for that reason. The biggest catch is that the session has to be running for this to work without changes because it’s grabbing the full file name with path from the DMVs for running sessions.

Anyways, here goes….

DECLARE 
	@SessionName SysName 
	, @TopCount Int = 1000

--SELECT @SessionName = 'UserErrors'
SELECT @SessionName = 'DurationOver5Sec'
--SELECT @SessionName = 'system_health'
/* 
SELECT * FROM sys.traces

SELECT  Session_Name = s.name, s.blocked_event_fire_time, s.dropped_buffer_count, s.dropped_event_count, s.pending_buffers
FROM sys.dm_xe_session_targets t
	INNER JOIN sys.dm_xe_sessions s ON s.address = t.event_session_address
WHERE target_name = 'event_file'
--*/

SET STATISTICS IO, TIME ON

IF OBJECT_ID('tempdb..#Events') IS NOT NULL BEGIN
	DROP TABLE #Events
END

IF OBJECT_ID('tempdb..#Queries') IS NOT NULL BEGIN
	DROP TABLE #Queries 
END

DECLARE @Target_File NVarChar(1000)
	, @Target_Dir NVarChar(1000)
	, @Target_File_WildCard NVarChar(1000)

SELECT @Target_File = CAST(t.target_data as XML).value('EventFileTarget[1]/File[1]/@name', 'NVARCHAR(256)')
FROM sys.dm_xe_session_targets t
	INNER JOIN sys.dm_xe_sessions s ON s.address = t.event_session_address
WHERE s.name = @SessionName
	AND t.target_name = 'event_file'

SELECT @Target_Dir = LEFT(@Target_File, Len(@Target_File) - CHARINDEX('\', REVERSE(@Target_File))) 

SELECT @Target_File_WildCard = @Target_Dir + '\'  + @SessionName + '_*.xel'

--SELECT @Target_File_WildCard

SELECT TOP (@TopCount) CAST(event_data AS XML) AS event_data_XML
INTO #Events
FROM sys.fn_xe_file_target_read_file(@Target_File_WildCard, null, null, null) AS F
ORDER BY File_name DESC
	, file_offset DESC 

SELECT  EventType = event_data_XML.value('(event/@name)[1]', 'varchar(50)')
	, Duration_sec = CAST(event_data_XML.value ('(/event/data[@name=''duration'']/value)[1]', 'BIGINT')/CASE WHEN event_data_XML.value('(event/@name)[1]', 'varchar(50)') LIKE 'wait%' THEN 1000.0 ELSE 1000000.0 END as DEC(20,3)) 
	, CPU_sec = CAST(event_data_XML.value ('(/event/data[@name=''cpu_time'']/value)[1]', 'BIGINT')/1000000.0 as DEC(20,3))
	, physical_reads_k = CAST(event_data_XML.value ('(/event/data  [@name=''physical_reads'']/value)[1]', 'BIGINT')/1000.0 as DEC(20,3))
	, logical_reads_k = CAST(event_data_XML.value ('(/event/data  [@name=''logical_reads'']/value)[1]', 'BIGINT') /1000.0 as DEC(20,3))
	, writes_k = CAST(event_data_XML.value ('(/event/data  [@name=''writes'']/value)[1]', 'BIGINT')/1000.0 as DEC(20,3))
	, row_count = event_data_XML.value ('(/event/data  [@name=''row_count'']/value)[1]', 'BIGINT')
	, Statement_Text = ISNULL(event_data_XML.value ('(/event/data  [@name=''statement'']/value)[1]', 'NVARCHAR(4000)'), event_data_XML.value ('(/event/data  [@name=''batch_text''     ]/value)[1]', 'NVARCHAR(4000)')) 
	, TimeStamp = DateAdd(Hour, DateDiff(Hour, GetUTCDate(), GetDate()) , CAST(event_data_XML.value('(event/@timestamp)[1]', 'varchar(50)') as DateTime2))
	, SPID = event_data_XML.value ('(/event/action  [@name=''session_id'']/value)[1]', 'BIGINT')
	, Username = event_data_XML.value ('(/event/action  [@name=''server_principal_name'']/value)[1]', 'NVARCHAR(256)')
	, Database_Name = DB_Name(event_data_XML.value ('(/event/action  [@name=''database_id'']/value)[1]', 'BIGINT'))
	, client_app_name = event_data_XML.value ('(/event/action  [@name=''client_app_name'']/value)[1]', 'NVARCHAR(256)')
	, client_hostname = event_data_XML.value ('(/event/action  [@name=''client_hostname'']/value)[1]', 'NVARCHAR(256)')
	, result = ISNULL(event_data_XML.value('(/event/data  [@name=''result'']/text)[1]', 'NVARCHAR(256)'),event_data_XML.value('(/event/data  [@name=''message'']/value)[1]', 'NVARCHAR(256)'))
	, Error = event_data_XML.value ('(/event/data  [@name=''error_number'']/value)[1]', 'BIGINT')
	, Severity = event_data_XML.value ('(/event/data  [@name=''severity'']/value)[1]', 'BIGINT')
	, EventDetails = event_data_XML 
INTO #Queries
FROM #Events

SELECT q.EventType
	, q.Duration_sec
	, q.CPU_sec
	, q.physical_reads_k
	, q.logical_reads_k
	, q.writes_k
	, q.row_count
	, q.Statement_Text
	, q.TimeStamp
	, q.SPID
	, q.Username
	, q.Database_Name
	, client_app_name = CASE LEFT(q.client_app_name, 29)
					WHEN 'SQLAgent - TSQL JobStep (Job '
						THEN 'SQLAgent Job: ' + (SELECT name FROM msdb..sysjobs sj WHERE substring(q.client_app_name,32,32)=(substring(sys.fn_varbintohexstr(sj.job_id),3,100))) + ' - ' + SUBSTRING(q.client_app_name, 67, len(q.client_app_name)-67)
					ELSE q.client_app_name
					END  
	, q.client_hostname
	, q.result
	, q.Error
	, q.Severity
	, q.EventDetails
FROM #Queries q
--WHERE eventtype NOT IN /*rather typical filtering*/ ('security_error_ring_buffer_recorded', 'sp_server_diagnostics_component_result', 'scheduler_monitor_system_health_ring_buffer_record')
	--AND eventtype NOT IN /*specific troubleshooting filtering*/ ('connectivity_ring_buffer_recorded', 'wait_info')
ORDER BY TimeStamp DESC 

The top is all I typically edit. The Session Name is ‘DurationOver5Sec’ for this purpose, but as you can see it can also read some of the information from the system_health session. The TopCount is just saying I’m only going to look at the most recent 1,000 records BEFORE I shred and filter it, mostly because I love my CPU and this changes how much XML I’m throwing at it.

No matter how I write this to filter before playing with XML or try to be 100% safe, my scripts will not be perfect for you.  In fact they may crash your server. Unfortunately, I’m only half kidding, because nothing is 100%. The space is limited to 50 MB, the overhead of writing to this file should be fine since we’re only working with events that took over 5 seconds asynchronously with data loss allowed, so I don’t foresee any issues in most cases unless you change these numbers. However, reading them gets expensive and you have to use the most caution here.  Keep in mind that you can put the .xel files on any server with SQL installed, even developer edition, and query it.

Why’d I write this and what else is going through my head?

The inspiration for this post actually came from a question a former coworker asked me quite a while ago, just seeing if I knew a lot about Extended Events.  At the time the technically correct answer was “I don’t know”, but instead I told him that although I didn’t have experience with Extended Events that he could look at Jonathan Kehayias’s (b|t) blog, specifically his XEvent A Day Series.  However, I also warned him that Jonathan’s work tends to go deeper than a beginner is prepared for and that he should start with his coworker, Erin Stellato’s (b|t), version that is easier to start with, specifically her Making the Leap From Profilers to Extended Events session she made available on YouTube. This actually inspired two blog posts, I just haven’t written the How to Say “I don’t know” Better post yet.

More Links

It is so wrong that I originally posted this without linking to Erin Stellato’s Extended Events Stairway Series on SQL Server Central.  There, problem is fixed.

Have fun, experiment (with queries), and ask questions.

Optional Parameters Causing Index Scans

Optional parameters in a stored procedure often lead to scans in the execution plan, reading through the entire table, even if it’s obvious that the right index is in place. This is extremely common in procs that are used behind search screens where, for example, you could search for a person according to their first name, last name, city, state, zip code, gender, etc.

To take a simplified look at this, make a quick and easy table consisting of an indexed identity column for us to search by and fluff to make the row size bigger.

CREATE TABLE Test 
(
    ID Int NOT NULL Identity(1,1) PRIMARY KEY
    , Value CHAR(500) NOT NULL
)
GO

INSERT INTO Test (Value)
SELECT '';
GO 250

INSERT INTO Test (Value)
SELECT TOP (1000) Value 
FROM Test 
GO 100

Now we’ll create a proc to get data. In this proc we’ll get the data several different ways, showing the advantages and disadvantages of each method.  You’ll notice that I put my comments as PRINT statements, which will make it easier for you to read through the messages tab and see what’s going on.

CREATE PROC proc_Testing 
    @ID int = 125
    , @MinID int = 100
    , @MaxID int = 150
AS 

SET STATISTICS IO ON
SET NOCOUNT ON

PRINT 'Clustered index scan, because the query optimizer has to be prepared for both null and non-null values'

SELECT *
FROM Test 
WHERE @ID = Test.ID OR @ID IS NULL

PRINT ''
PRINT 'It''s a small mess, but the query optimizer knows exactly what to expect for each query.'

IF @ID IS NOT NULL BEGIN
    SELECT *
    FROM Test 
    WHERE @ID = Test.ID 
END ELSE BEGIN
    SELECT * 
    FROM Test
END 

PRINT ''
PRINT 'Expand that to two possible parameters and it still looks simple right now, when it''s doing a scan'
SELECT *
FROM Test 
WHERE (ID >= @MinID OR @MinID IS NULL)
    AND (ID <= @MaxID OR @MaxID IS NULL)
    
PRINT ''
PRINT 'Make it optimized with IF statements and it quickly becomes a big mess.'  
PRINT 'Many "search screen" queries will have 20 or more optional parameters, making this unreasonable'

IF @MinID IS NOT NULL BEGIN
    IF @MaxID IS NOT NULL BEGIN
        SELECT * 
        FROM Test 
        WHERE ID BETWEEN @MinID and @MaxID 
    END ELSE BEGIN
        SELECT *
        FROM Test 
        WHERE ID >= @MinID 
    END
END ELSE BEGIN
    IF @MaxID IS NOT NULL BEGIN
        SELECT * 
        FROM Test 
        WHERE ID <= @MaxID 
    END ELSE BEGIN
        SELECT *
        FROM Test 
    END
END

PRINT ''
PRINT 'However, the query optimizer can get around that if it''s making a one-time use plan'

SELECT *
FROM Test 
WHERE (ID >= @MinID OR @MinID IS NULL)
    AND (ID <= @MaxID OR @MaxID IS NULL)
OPTION (RECOMPILE)

PRINT ''
PRINT 'And again with the single parameter'

SELECT * 
FROM Test
WHERE ID = @ID OR @ID IS NULL 
OPTION (RECOMPILE)

PRINT ''
PRINT 'However, this leaves two nasty side effects.'
PRINT 'First, you create a new plan each time, using CPU to do so.  Practically unnoticed in this example, but it could be in the real world.'
PRINT 'Second, you don''t have stats in your cache saying how indexes are used or what your most expensive queries are.'
PRINT ''
PRINT 'Another option is dynamic SQL, which still has most of the first flaw, and can also bloat the cache'

DECLARE @Cmd NVarChar(4000)

SELECT @Cmd = 'SELECT * FROM Test WHERE 1=1'

IF @ID IS NOT NULL BEGIN
    SELECT @Cmd = @Cmd + ' AND ID = ' + CAST(@ID AS VarChar(100))
END

IF @MinID IS NOT NULL BEGIN
    SELECT @Cmd = @Cmd + ' AND ID >= ' + CAST(@MinID AS VarChar(100))
END

IF @MaxID IS NOT NULL BEGIN
    SELECT @Cmd = @Cmd + ' AND ID <= ' + CAST(@MaxID AS VarChar(100))
END

EXEC (@Cmd) 

PRINT ''
PRINT 'Yes, you can do sp_executesql which can be parameterized, but it gets more difficult.'

Now that we have the data and proc, just execute it. It will be best if you add the actual execution plans to this, which you can get to on your menu going to Query / Include Actual Execution Plan. If you don’t know how to read execution plans then this is even better! No experience necessary with plans this simple, and you’ll start to feel more comfortable around them.

EXEC Proc_Testing

Even with the default values for the parameters the query optimizer knows that you could have easily passed in NULL for the values, and it has to plan for everything. Lets step through the results to see what this all means.  Part of that planning for everything is saying that @ID IS NULL will be used instead of ID = @ID, so the query optimizer can’t say for sure that it can just perform a seek on that column.

In the messages tab we have the number of reads done by each statement courtesy of me adding SET STATISTICS IO ON in the proc itself (bad idea in prod, by the way). For the first one we have 7272 logical reads, saying we read 7272 pages of 8kb of data, so we had ask the CPU to play around with over 56 MB of data to find records that matched.

Looking at the execution plan we can see why that happened. The Predicate you can think about as the “Scan Predicate”, since it’s saying what you couldn’t seek for and had to scan instead. In this case it’s showing the entire “@ID = Test.ID OR @ID IS NULL” in there, because it compiled a reusable plan that might be used with a NULL.

Execution Plan of Query 1

In the next statement we were able to do a seek, doing only 3 reads. This is because there are two levels of the B+tree on this index, so it read the root level, then the next level of the B+tree, and finally the single leaf level of the index that contained the data we wanted.

Take a look at the execution plan here to see the difference with not only the Seek itself, but the Seek Predicate in the details. You’ll see that it uses @ID in there still showing that it’s a reusable plan ready for any ID to be passed in, but the WHERE clause is telling the query optimizer that it can always use a seek to find this data.

Execution Plan of Query2

Now that I know you can read through a couple yourself, I’ll skip ahead to the 6th query where we used the same “@ID = Test.ID OR @ID IS NULL” that caused is trouble before, but did OPTION (RECOMPILE) at the end of the statement. Again it did the same 3 reads I just mentioned still using a seek, but the details of the execution plan looks different. The seek predicate used to say @ID so it could be reused, but the query optimizer knows nothing with OPTION (RECOMPILE) will get reused. Knowing that, it simply converted @ID into a constant value of 125 and was able to eliminate the possibility of 125 being NULL.

Execution Plan of Query 6

If you want to get more into the details, you can look at the XML version of the execution plan by right-clicking on the plan and selecting “Show Execution Plan XML…”. Here’s what you’ll find for the parameter’s value in the first two queries. It shows that the value that was sniffed when it was compiled was 125, and also that it was run this time with a value of 125. If you ran this again passing 130 in then you’d see the sniffed value staying at 125 because it’s not going to use CPU resources to recompile it, but the runtime value will be 130 for that run.

<ParameterList>
  <ColumnReference Column="@ID" ParameterCompiledValue="(125)" ParameterRuntimeValue="(125)" />
</ParameterList>

The OPTION(RECOMPILE) versions don’t look like this though, they’re changed to a constant value even at this level.

<RangeColumns>
  <ColumnReference Database="[tempdb]" Schema="[dbo]" Table="[Test]" Column="ID" />
</RangeColumns>
<RangeExpressions>
  <ScalarOperator ScalarString="(125)">
    <Const ConstValue="(125)" />
  </ScalarOperator>
</RangeExpressions>

I hope I left you with a better understanding of what happens when you write code for parameters that could be null. We’ve all done this, and many of us (me especially) have been frustrated with the performance. This is a change I put into production not too long ago that ended scans on a rather large table, and the results were noticed in query execution time, the page life expectancy counter since the entire table was no longer being read into memory, and I/O activity levels since that index and the indexes it kicked out of memory didn’t have to be read off of disk nearly as often.

Let me know what you think, and especially if you have a better way of handling this issue.

Why worry about CXPACKET

TSQL2SDAYMany people see CXPACKET at the top of their waits and start trying to fix it. I know this topic’s been done before, but people ask me about it enough that it should be done again, and again. In fact, Brent Ozar wrote an excellent article about it, and Jonathan Kehayias wrote an article about tweaking it using the cost threshold of parallelism. Even with those, it took Grant Fritchey warning us to be careful about giving guidance to lead me to Bob Ward’s take on it.  After all of these people and more saying CXPACKET isn’t what you think it is, enough people have it all wrong to the point that I felt this was the biggest piece of public opinion to speak out against for Michael Swart’s T-SQL Tuesday #052.

BOL still doesn’t state it completely clear when it defines it as “Occurs with parallel query plans when trying to synchronize the query processor exchange iterator. If waiting is excessive and cannot be reduced by tuning the query (such as adding indexes), consider adjusting the cost threshold for parallelism or lowering the degree of parallelism.” The true meaning of this wait is much easier, with Bob Ward’s explanation of “This wait type only means a parallel query is executing.”

Yes, that’s it, it’s not really all that complex. If you have a MAXDOP of 4 then you could end up with 5 threads. Think of it as having one manager who can delegate work out to 4 subordinates. The subordinates do their pieces of the job and the manager marks down CXPACKET on his time sheet while he waits for them. When they finish, the manager compiles their work (repartitions the streams if you want). There was a little extra work done here because the manager wouldn’t have to combine all the work if he did it all on his own (MAXDOP = 1), and it’s possible the subordinates did more work than they had to. However, in most cases, it does get done faster, and duration is what all your users talk about.

The advice in BOL above saying “consider adjusting the cost threshold for parallelism or lowering the degree of parallelism” is incomplete at best. Upping the cost threshold is exactly what it sounds like, making it so only more expensive tasks can be assigned to those subordinates. Then lowering the degree of parallelism is just dropping how many subordinates you can use.

Cost Threshold for Parallelism is something Brent Ozar makes fun of a bit, because it’s a default of 5 units that are undefined anymore. Jeremiah Peschka recommends setting this to 50 and tweaking it from there. I’d recommend 25 for most OLTP because I like parallelism and my procs aren’t stressed. However, the point is that you should only tweak what you understand, and now I hope you have a descent understanding of this. If you have a lot moderately large queries you wish could break out the work to get it done faster, drop it. If all of your CPUs are running hot and you wish less work was being done repartitioning streams or compiling more complex plans, raise it.

Max Degree of Parallelism is what people really like to tweak, and it’s usually a bad idea. My personal recommendation is to set it to 4 in OLTP (higher in OLAP, very dependent on your load) and forget it unless you have a really, really good reason to change it. The default of 0 is absolutely horrible for OLTP on larger servers, where this could mean that you’re breaking out a task and assigning it to 80 or more subordinates, then trying to put all of their work back together, and killing yourself doing it. This shouldn’t be above 8 unless you really like to be overworked putting your subordinates’ work back together and dealing with those performance problems. However, it’s great to have subordinates who can help you out when needed, so please don’t drop this below 4 unless you have an amazing reason to do so, and only on the query level if you only have one amazing reason.

So, what do you do when CXPACKET is taking over? The trick is to think of it in terms of how a business would work. You have a ton of work to do, enough where your managers are going crazy trying to find subordinates to do it for them. Do you tell your managers to do it themselves OPTION(MAXDOP=1), do you tell them to go out and find as many subordinates as they can OPTION(MAXDOP=0), or do you tell them you’ll see if you can help them find a more efficient way to do their jobs?

If you have the Cost Threshold for Parallelism set to 25 or 50 you have a descent limit before you consider spreading the load around. So, what takes that long for your server to handle? A good portion of the time you’ll find this when you’re scanning a large index or table, or even doing a very expensive seek. If you look at your execution plan is it doing a scan? If it’s a seek that’s starting your parallelism then does it have a small “Seek Predicate” and a lot to do in the “Predicate” in the properties for that operator? It could be that you could use better indexes, it could be that you could find a more SARGable approach, or a variety of other performance tuning opportunities.

The thing is that parallelism isn’t bad and CXPACKET is saying you’re using a good thing. A high CXPACKET could mean you’re trying to use too much of a good thing because you’re “overworking your managers”, but the workload is typically more of an issue than the fact that you let your manager delegate their work when there’s enough to go around. A CXPACKET a lot higher than your baseline could mean that you have poor statistics or parameter sniffing that’s causing a bad execution plan, or it could mean you have a new query that could use some attention.  When you’re talking about parallelism it’s also possible that the statistics were off and one thread (subordinate) ends up doing 99% of the work, making CXPACKET jump up, and that can be found in the actual execution plans; read more about that in Grant Fritchey’s book.

If you have a MAXDOP around 4 (between 2 and 8, reading these recommendations) and Cost Threshold of 25 or higher then I’d be looking into the workload more than the fact that you’re using parallelism. Sure, some tasks just don’t take well to parallelism and there’s reasons to use a MAXDOP=1 hint, but it’s rare to need to take it down to 2 on the server level and even more rare to turn if off by taking it down to 1.

What ever you do, when you have “a big query using parallelism”, try to focus on “a big query” first, it’s usually the problematic part of that statement.

Related articles

Cleaning up the Buffer Pool to Increase PLE

Chances are you have extra information in the buffer pool for a bad query and it’s dragging down your PLE, causing SQL Server to run slower because it’s reading more from disk. Although this approach is taking a 180 from my post Fixing Page Life Expectancy it has the same effect, with that post focusing on fixing your worst queries and this one focused on fixing your most misused indexes.  One approach doesn’t replace the other, it’s more like burning the candle at both ends, except that you end up with a better running database instead of getting burnt out.

With this approach we start with what’s in the cache.  You’ll see the same types of issues in almost any database, and this just happens to be a production database I’m going through today.

ScreenHunter_01 2014-01-06 14.52.28

The results were found with this query:

SELECT count(1)/128 AS cached_MB 
    , name 
    , index_id 
FROM sys.dm_os_buffer_descriptors AS bd with (NOLOCK) 
    INNER JOIN 
    (
        SELECT name = OBJECT_SCHEMA_NAME(object_id) + '.' + object_name(object_id)
            --name = 'dbo.' + cast(object_id as varchar(100))
            , index_id 
            , allocation_unit_id
        FROM sys.allocation_units AS au with (NOLOCK)
            INNER JOIN sys.partitions AS p with (NOLOCK) 
                ON au.container_id = p.hobt_id 
                    AND (au.type = 1 OR au.type = 3)
        UNION ALL
        SELECT name = OBJECT_SCHEMA_NAME(object_id) + '.' + object_name(object_id) 
            --name = 'dbo.' + cast(object_id as varchar(100))   
            , index_id
            , allocation_unit_id
        FROM sys.allocation_units AS au with (NOLOCK)
            INNER JOIN sys.partitions AS p with (NOLOCK)
                ON au.container_id = p.partition_id 
                    AND au.type = 2
    ) AS obj 
        ON bd.allocation_unit_id = obj.allocation_unit_id
WHERE database_id = db_id()
GROUP BY name, index_id 
HAVING Count(*) > 128
ORDER BY 1 DESC;

Service Broker Errors Table

First, there is an errors table here with Service_Broker_Errors, and that should never be in the top 10. What are we doing wrong? The index ID of 1 tells me right away that this is a clustered index, the fact that the table is at least 1.5 GB tells me that we’re probably not purging old data, and 1.5 GB in memory on this table is hinting that we’re probably doing a clustered index scan.

I’ll start by looking at the proc cache to see what’s going on. There’s only one execution plan that used that index and it is, in fact, doing a clustered index scan as I expected.

ScreenHunter_01 2014-01-06 15.24.05

Predicates or Seek Predicates

In an execution plan you’ll have a seek predicate and just a plain old predicate. The seek predicate is what you were able to do taking advantage of the index being in order, and the predicate is what you had to scan for.

ScreenHunter_01 2014-01-06 15.26.02

This case is easy because we’re only searching by a single column, but others could have both a seek predicate and a predicate. For instance, if I had an index on my customers table with the key columns Active, First_Name, Last_Name then searched where Active = 1 and Last_Name = ‘Hood’ then it will show up as an index seek with a seek predicate of Active = 1 and a predicate of Last_Name = ‘Hood’. Anyways, lets get back on topic with the issue of my Service_Broker_Errors table…

Now this sounds like a reasonable query looking for errors. I’m looking for the errors that occurred in the last so many days. The CONVERT_IMPLICIT(datetime,[@1],0) shows me that someone typed this the lazy way of GetDate()-1, which isn’t as efficient as DateAdd(Day, -1, GetDate()), but you’re getting me off topic again.

Fixing a useless index

Looking at the indexes on this table I realize there is only one, and it has the single key column of ID. For uniqueness you can’t do much better than an ID column, but you have to ask yourself if you’ll ever use it to query by.  In this case the index has never had a seek against it, only scans.  Although there table is rarely queried with only 4 uses in the last 2 months (I limited my historical data for this query), it’s still pulling 1.5 GB into cache for every use.  After a couple seconds of shaking my head I start to create a change request to make add TimeStamp in as the first key column in the clustered index.

ScreenHunter_01 2014-01-06 15.35.27

However, I then remembered that this table is 1.5 GB. Is that right? It’s an error table, so if it’s really 1.5 GB then I should either be cleaning up old data or there are so many problems that there is no reason I should be spending my time tuning. Seeing that it has 0 updates in the last 2 months, I already know it’s old data.  To double-check on this I run a simple query, keeping in mind the ID is still the clustered index, to find the oldest record, and discover that we haven’t removed anything from this table in years.

SELECT timestamp
FROM Service_Broker_Errors
WHERE id = (SELECT Min(ID) FROM Service_Broker_Errors)

So I have to talk to people about how old an error can be before we say we just don’t care. It was determined that we probably don’t care about anything more than a month old. I’m paranoid, it comes with the job title, so I made it three months with my change being this:

DECLARE @ID Int

SELECT @ID = MAX(ID) FROM Service_Broker_Errors WHERE TimeStamp < GETDATE()-90 

WHILE @@ROWCOUNT > 0 BEGIN
    DELETE TOP (10000)
    FROM Service_Broker_Errors
    WHERE ID <= @ID 
END 

IF EXISTS (SELECT * FROM sys.indexes WHERE object_id = OBJECT_ID(N'[dbo].[Service_Broker_Errors]') AND name = N'PK_Service_Broker_Errors') 
    ALTER TABLE [dbo].[Service_Broker_Errors] 
    DROP CONSTRAINT [PK_Service_Broker_Errors] 
GO 

ALTER TABLE [dbo].[Service_Broker_Errors] 
ADD CONSTRAINT [PK_Service_Broker_Errors] PRIMARY KEY CLUSTERED 
( 
    [TimeStamp] ASC
    , [id] ASC 
)WITH (PAD_INDEX = OFF, STATISTICS_NORECOMPUTE = OFF, IGNORE_DUP_KEY = OFF, ALLOW_ROW_LOCKS = ON, ALLOW_PAGE_LOCKS = ON) ON [PRIMARY] 
GO 

The reason I did it like this is because I don’t want to fool around with the junk values as I drop the clustered index (rebuilding the table) then recreate the clustered index (rebuilding the table) with all of that information in there, then delete it all and wreak havoc on the new index. Sure, the fragmentation at the page level would be fine since I’m deleting in order, but that’s a lot of changes to the b-tree.

Finally, I add these lines to my nightly cleanup job to keep things trimmed up from now on:

DECLARE @BatchSize Int 

SELECT @BatchSize = 10000 

WHILE @@ROWCOUNT > 0 BEGIN
    DELETE TOP (@BatchSize)
    FROM Service_Broker_Errors
    WHERE TimeStamp < GETDATE()-90
END

I know, I just got done saying that GetDate()-90 was less efficient than DateAdd(Day, -90, GetDate()), but it’s an implicit conversion that’s done once per call. I admit this is a bad habit of mine, and any time there’s even a chance of this being called once per row I have to write it differently than I normally do. Nobody’s perfect, and the most important thing is that I’m getting rid of all those records using batches, right?

In Conclusion with Service Broker Errors

Now that all of this is done I took a 1.5 GB table with all of it in cache to a 20 MB table with only 1 MB in cache. Cleaning up the data had more of an impact that my index change, but it’s usually not that easy to clean stuff up. Even if I wasn’t able to clean up the data, the index change alone would have allowed for the cache usage to be decreased by at least 1.4 GB.

On to the next one

That’s not the only issue I’m seeing here, in fact I bet I could take half of these off the top 10 list. However, today I’m picking up low-hanging fruit and moving on to the next task on my list. In this case, External_Messages is the next one that doesn’t look right to me. Once again, it’s a clustered index (index_id = 1) of a table that isn’t part of the primary focus of the database, which is handling orders.

Starting with the same steps I look in the proc cache to see what put this here. Once again I see a single query in cache referencing the table, but this one is different. It’s the typical IF X = @X or @X IS NULL that we’ve all written, and it’s being used as the predicate.

ScreenHunter_01 2014-01-06 16.34.32

I check the indexes on the table and it has the ID as the only key column of the clustered index, so that’s not an issue. Why isn’t it able to use the clustered index with a seek predicate? After all, I’m rather certain that they almost always, if not always, call this with a parameter where it should be filtered down.

Lets look at the execution plan to make sure. The sniffed parameter value from the first time it was called, as found at the bottom of that statement in the XML version of the execution plan, is, in fact, a non-null value.

ScreenHunter_01 2014-01-06 16.39.02

However, SQL Server can’t guarantee that you’re going to pass it a non-null value, and it has to make an execution plan that can account for either possibility. I’ve seen this before, so I know the basic options for a single optional parameter (there are more options, with increasing complexity). I can either add OPTION (RECOMPILE) to the query or I can rewrite it to be two separate queries.

OPTION (RECOMPILE)

Here’s the option I didn’t choose. This will recompile the statement every run, which isn’t too much of a problem because it’s a quick compile on something that only runs a couple times a day. However, it will make it so this doesn’t show up in the proc cache anymore, which I take advantage of quite a bit (for instance, look at the blog post you’re currently reading). Also, it goes against my rule of using hints as a last resort.
That’s not saying you can’t do it this way, just that I didn’t. The reason it works is because SQL Server knows when it makes this execution plan that it will only be used once, so it doesn’t have to account for the possibility of it being a NULL value next run. In fact, it just makes the execution plan with your parameter as a constant value.

ScreenHunter_01 2014-01-06 16.51.09

Two queries

Here’s the method I decided to go with. Assuming third-normal form doesn’t apply to query text, you should be good to go here. If it’s simple enough then it will be very obvious to anyone editing this at a later point that they need to make any changes in two places.

CREATE PROC NotTheRealProcName
    @id INT = NULL
AS

IF @id IS NULL BEGIN 
    SELECT ID
        , Subject
        , Message
        , DateAdded 
    FROM ExternalMessage EM
END ELSE BEGIN
    SELECT ID
        , Subject
        , Message
        , DateAdded 
    FROM ExternalMessage EM
    WHERE ID = @ID
END

This solution isn’t too complex with just a single parameter as it only creates two queries, but if you get just three parameters and try to do this then you’re up to 8 queries. The OPTION (RECOMPILE) method starts to look pretty good as a quick and easy fix before too long. I would still prefer one of the long and drawn out methods, such as getting interim results to a temp table, making it look a little more complex, but getting it to run efficiently with a cached plan.

It worked as I expected, with no one actually getting all of the IDs. I left the code in place to make it possible to get all of them to avoid digging through all of the application code to find where it could return everything then make sure it gets changed there. The result I was looking for was cleaning up the cache, which I got when this dropped from 1.4 GB down to 25 MB in cache.

The End

Overall I was able to drop about 3 GB out of cache, making room for other data while raising the PLE, in two simple changes that were rather easy to track down just by saying “that doesn’t look like it belongs here”. Even the ones that do look like they belong there probably don’t need to have that large of a presence in the cache.

Although I didn’t actually measure the impact that it would have on the end users in these cases because I didn’t start with a performance complaint, I would imagine that SQL Server tends to run faster returning processing 1 row it found quickly instead of reading through a couple million. So, measured or not, I’ll count that as a success as well.

PS. Jonathan Kehayias helped me

My queries looking into the proc cache are slightly modified versions of Jonathan’s work on his blog. Honestly, it didn’t need tweaked or touched for any reason other than the fact that I learn by tinkering. I did help myself by adding in filtering by database because I have a couple servers that have multiple copies of the same database, but, again, it worked great before I touched it, which is something you should expect from Jonathan’s work.

Here’s my altered version:

SET TRANSACTION ISOLATION LEVEL READ UNCOMMITTED;
DECLARE @IndexName SYSNAME = '[PK_ExternalMessage]'; 
DECLARE @DatabaseName SYSNAME;

SELECT @DatabaseName = '[' + DB_NAME() + ']';

WITH XMLNAMESPACES
   (DEFAULT 'http://schemas.microsoft.com/sqlserver/2004/07/showplan')
SELECT
    n.value('(@StatementText)[1]', 'VARCHAR(4000)') AS sql_text,
    n.query('.'),
    cp.plan_handle,
    i.value('(@PhysicalOp)[1]', 'VARCHAR(128)') AS PhysicalOp,
    i.value('(./IndexScan/@Lookup)[1]', 'VARCHAR(128)') AS IsLookup,
    i.value('(./IndexScan/Object/@Database)[1]', 'VARCHAR(128)') AS DatabaseName,
    i.value('(./IndexScan/Object/@Schema)[1]', 'VARCHAR(128)') AS SchemaName,
    i.value('(./IndexScan/Object/@Table)[1]', 'VARCHAR(128)') AS TableName,
    i.value('(./IndexScan/Object/@Index)[1]', 'VARCHAR(128)') as IndexName,
    i.query('.'),
    STUFF((SELECT DISTINCT ', ' + cg.value('(@Column)[1]', 'VARCHAR(128)')
       FROM i.nodes('./OutputList/ColumnReference') AS t(cg)
       FOR  XML PATH('')),1,2,'') AS output_columns,
    STUFF((SELECT DISTINCT ', ' + cg.value('(@Column)[1]', 'VARCHAR(128)')
       FROM i.nodes('./IndexScan/SeekPredicates/SeekPredicateNew//ColumnReference') AS t(cg)
       FOR  XML PATH('')),1,2,'') AS seek_columns,
    RIGHT(i.value('(./IndexScan/Predicate/ScalarOperator/@ScalarString)[1]', 'VARCHAR(4000)'), len(i.value('(./IndexScan/Predicate/ScalarOperator/@ScalarString)[1]', 'VARCHAR(4000)')) - charindex('.', i.value('(./IndexScan/Predicate/ScalarOperator/@ScalarString)[1]', 'VARCHAR(4000)'))) as Predicate,
    cp.usecounts,
    query_plan
FROM (  SELECT plan_handle, query_plan
        FROM (  SELECT DISTINCT plan_handle
                FROM sys.dm_exec_query_stats WITH(NOLOCK)) AS qs
        OUTER APPLY sys.dm_exec_query_plan(qs.plan_handle) tp
      ) as tab (plan_handle, query_plan)
INNER JOIN sys.dm_exec_cached_plans AS cp 
    ON tab.plan_handle = cp.plan_handle
CROSS APPLY query_plan.nodes('/ShowPlanXML/BatchSequence/Batch/Statements/*') AS q(n)
CROSS APPLY n.nodes('.//RelOp[IndexScan/Object[@Index=sql:variable("@IndexName") and @Database=sql:variable("@DatabaseName")]]' ) as s(i)
--WHERE i.value('(./IndexScan/@Lookup)[1]', 'VARCHAR(128)') = 1
OPTION(RECOMPILE, MAXDOP 1);